
Based on the December 30th, 2011 Premium Update. Visit our archives for more gold articles.
Several Wall Street firms have recently published their gold price forecasts for 2012. Goldman Sachs predicts the price of gold will peak at $1,900 per ounce and average $1,810 per ounce in the coming year. Goldman attributes its bullish gold price outlook to further net buying by central banks and strong physical demand from investors, the ongoing negative real interest rate environment in the U.S., and continued European sovereign debt and global recessionary concerns.
The firm cautions that the biggest risk for the yellow metal is further strength from the U.S. dollar. As has been the case in recent months, investors could continue to view gold as more of a commodity than money and as a risky asset. Nevertheless, Goldman states that the factors influencing the yellow metal continue to point to higher prices in 2012.
Gold prices will rally again in 2012 to reach $2,000 to $2,500 per ounce according to a commodities strategist at Bank of America Merrill Lynch.
UBS have reiterated their bullish outlook for gold and believe gold will average $2,050/oz in 2012.
Barclays Capital says gold will average $2,000/oz in 2012 which is 25% above todays spot price.
John Embry, chief investment strategist of Sprott Asset Management, said the price of the yellow metal could possibly exceed $2,500 in the next 12 months.
At Sunshine Profits we also went out on a limb and guesstimated gold's high for 2011 at $1,800 and $45 for silver.
Australia's Bureau of Resources and Energy Economics forecast in its December quarterly report that gold prices in 2012 would still go up 17 per cent to $1,850 an ounce.
A survey of the Professional Numismatists Guild (www.PNGdealers.com), a non-profit organization composed of the country's top rare coin and bullion coin dealers, almost unanimously points toward price increases. Coin dealers predictions of where gold will close at the end of the first quarter in 2012 ranged from a low of $1,475 per ounce to a high of $2,155, with a mean average of $1,759.57. Their estimates for gold at the end of 2012 varied from $1,450 up to $2,575 with the average $1,976.22.
Predictions about silver in the first quarter varied from $24.35 per ounce to $57.50 with a mean average of $34.04, and from $23 to $130 with the average of $48.73 by the end of 2012.
The recent declines have left some gold investors feeling beaten, battered and bruised. But we have to keep in mind that over the long haul, gold is the ultimate safe haven and we believe that based on the underlying fundamentals which have not changed, it will go up in 2012. Our guesstimates for 2012 are $2,200 for gold and $50 for silver (silver is likely to outperform once it breaks through $50). Gold has risen 645% while the Dow Industrials has only gained 13% over the past decade. Gold has maintained its safe haven status for thousands of years and there is not another investment that can make that claim. No one ever mentions that in spite of the recent and much publicized decline, gold is still up $220.30/oz or 15.91% for the year. Thats almost double the gains in the Dow.
To have a sneak peak at the possible short run developments, let's begin the technical part with the analysis of gold itself. We will start with the very long-term chart (charts courtesy by http://stockcharts.com.)
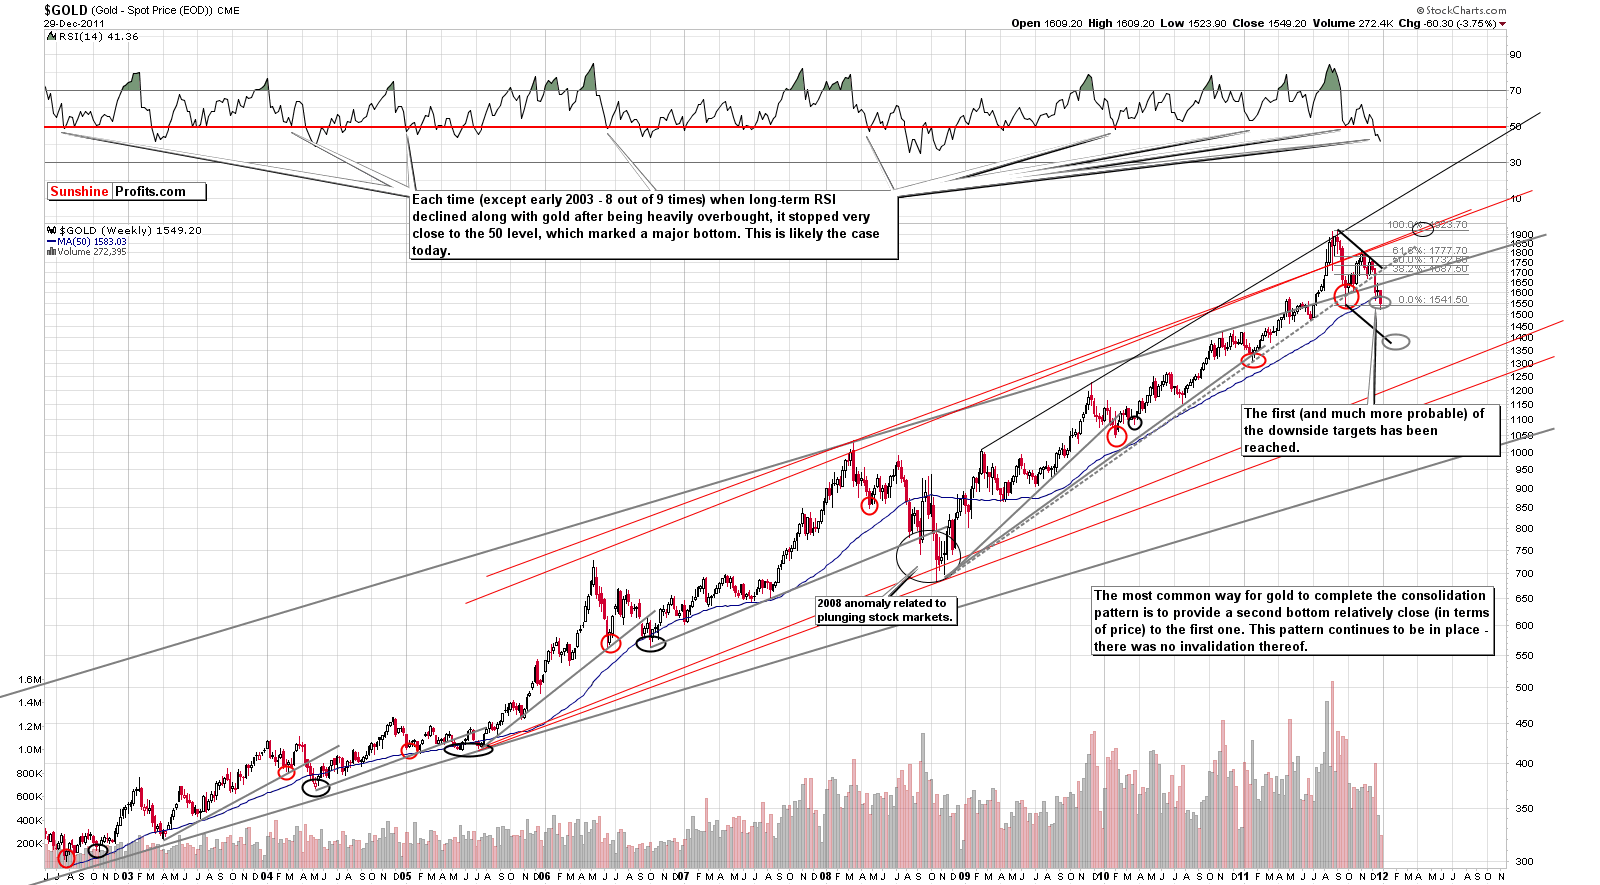
This week, we begin our gold section with a look at the very long-term chart (if youre reading this essay at www.sunshineprofits.com, you may click on the above chart to enlarge it). Very little has changed since last week and for now it seems that gold quite often consolidates in a way similar to what we've seen in the past months. We're not in uncharted waters we're seeing a quite common pattern in play.
The fact is that breakdowns similar to the one were seeing just now have been (in all cases seen on the chart) followed by the final bottom of the consolidation (not too far below the line that is has broken), which was in turn was followed by a strong rally. In these cases, lower prices were never seen thereafter. Consequently, from both fundamental and technical perspectives, gold remains in a bull market, and what we're seeing right now may be the best buying opportunity that we'll see in the coming years.
The pattern has not been invalidated and a move to the level of previous lows is quite normal behavior during a period of major correction. At this time, the situation truly does not appear to be bearish. Golds price is still above the September lows and no breakdown has been seen. Although prices did try to move below this level last week on Thursday, the attempt was unsuccessful. It did not hold, and gold reversed in intra-day trading and closed the day just above the $1,540 level.
We have adjusted our analysis due to the significance of the current consolidation pattern. Without any change in our long-term bullish outlook for gold, right now it seems that we may be on the brink of a change in the way gold trades. The current medium-term pattern is no longer viewed by us as a continuation of the 2011 rally that rally ended and were likely to see a new one start. This new behavior needs to be analyzed from more than one angle a thing we continually do in our full analysis.
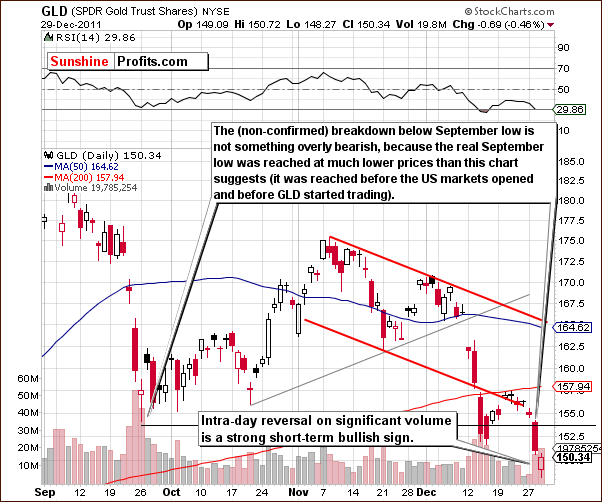
In the short-term GLD ETF chart, we first note the significant volume levels of the past two days. Price levels have reversed intra-day on significant volume and this is a short-term bullish signal. We have recently commented on the situation in gold we wrote that bottom in gold may be in and that the subsequent rally in gold is just about to start. In the latter we stated:
( ) the situation in the USD Index is more bearish than not. The breakout above the declining long-term resistance line may be seen at some point, but until it is seen and verified, this situation here will not turn to bullish. The currently bearish outlook for the dollar translates into o rather bullish outlook for precious metals.
At present, data coming from the market seems to confirm this point of view.
Summing up, it seems that we have just seen a major bottom in the precious metals sector.
To make sure that you are notified once the new features are implemented, and get immediate access to my free thoughts on the market, including information not available publicly, we urge you to sign up for our free e-mail list. Sign up for our gold & silver mailing list today and you'll also get free, 7-day access to the Premium Sections on my website, including valuable tools and charts dedicated to serious PM Investors and Speculators. It's free and you may unsubscribe at any time.
Thank you for reading. Have a great weekend and profitable week!
P. Radomski
--
Among featuring other things, in the full version of the above essay we discuss the situation on the USD Index and the general stock market (and their impact on precious metals based on our Correlation Matrix) and we thoroughly analyze gold, silver and mining stocks. Among other things we analyze: silver's long-term cycles, volume in gold and gold stocks, silver's breakdown, miners' performance relative to other stocks and Gold Miners Bullish Percent Index.
Additionally, in the Dec 17th 2010 update we provided guesstimated targets for this year ($1,800 for gold and $45 for silver) and this time we continue the "tradition" by providing analogous targets for 2012. We also comment on the article entitled Soros Sees Gold Prices on Brink of Bear Market.
We encourage you to Subscribe to the Premium Service today and read the full version of this week's analysis right away.
