
Based on the February 15th, 2013 Premium Update. Visit our archives for more gold & silver articles.
This week price moves in the gold market could certainly give investors the creeps. The yellow metal opened at around $1,668 on Monday, closed $1,634 on Thursday and is currently (at the moment of writing these words) at $1,606.
We have stressed it many times that in order to make long-term investment decision one should put more weight on long-term charts rather than focusing on short-term noise. Today we will focus on the long-term gold chart - it gives the most insight into what may happen in the long run. Let us jump straight into it (charts courtesy by http://stockcharts.com)
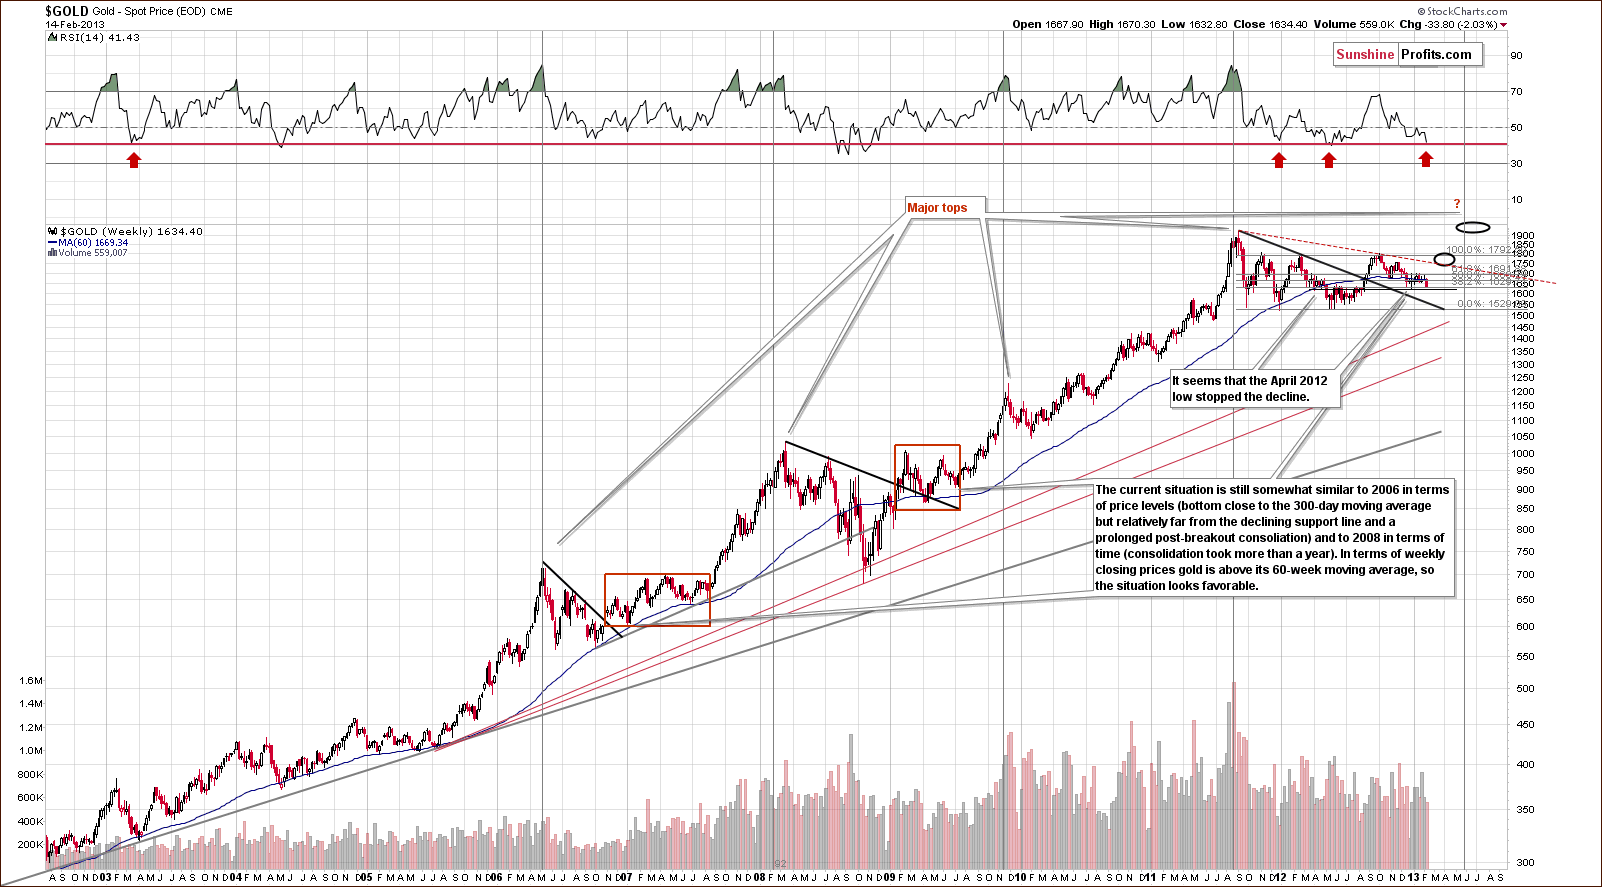
There are two things to focus on in this chart. The first is that the RSI levels have declined and are now at a level equal to those seen at the 2011 and 2012 bottoms, it seems very likely that a major bottom is either in or at hand now.
The second important point is that we have discovered a long-term cycle when analyzing gold market consolidations and how they evolve to rally and top. We generally project the price path that will be seen next, however, this time we thought of looking at when a top could be seen and inferring how gold might get there.
Note that the second stage of the gold bull market began in 2006 (breakout in terms of euro, acceleration in terms of the US dollar). From the major bottom in that year and after, we see strong relationships and that every two years or so, we have a major top preceded by a sharp rally. The coming top (long-term cyclical turning point) is suggested in late May, so a sharp rally is expected very soon, that is, prior to the May top Note that before this rally there may still be some short-term turmoil on the market â since we are talking about long-term signals, it is very hard to give a very precise starting point for a rally. This is yet another confirmation of our bullish theory for the coming weeks and months and supports staying in the market at this time.
The second gold chart for today is also of long-term nature.
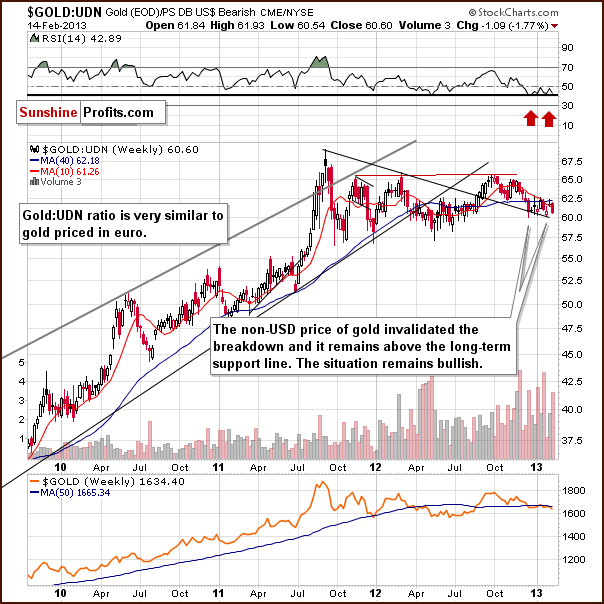
In this week's chart of gold from the non-USD perspective, we still see a bullish picture. Prices have consolidated after breaking out, and while the situation looks a bit discouraging (as not much happened in the past few months), it is still overall bullish in our view.
Summing up, the situation for the yellow metal remains bullish at this time. The analysis of this week's long-term chart uncovered some bullish signals based on a study of trading patterns seen since 2006. As always, implications gleaned from long-term charts carry more weight than those from shorter time periods and are the most important factors to be considered from this week's gold section. The bullish situation remains in place and RSI levels suggest an oversold situation similar to the major bottoms of 2011 and 2012. Although the short-term picture looks grim, the long term one is really encouraging, even though an additional short-term decline may be seen before the big rally.
The full version of today's analysis includes much more details than the above - including the likely short-term downside price target for gold. We encourage you to join our subscribers and read it right away.
Thank you for reading. Have a great weekend and profitable week!
Sincerely,
Przemyslaw Radomski, CFA
