
Based on the July 22nd, 2011 Premium Update. Visit our archives for more gold articles.
Recently, there has been much distrust of the political process in the U.S. where politicians are Dancing on the (debt) Ceiling, as the Lionel Ritchie song goes. Negotiations to raise the U.S. borrowing limit have continued to show little signs of progress, even as ratings agencies warn that a delay in payments to creditors would jeopardize the country's sterling credit rating. The Treasury Department has said that Congress must raise the U.S. debt limit before Aug. 2 to meet all of its obligations to creditors. There is also some conjecture about a third round of quantitative easing in the U.S. if economic conditions remain weak, although Federal Reserve Chairman Ben Bernanke commented last week that policy-makers are not ready to act at this time. President Obamas 50th birthday is coming up and if youre wondering what to get him, he could use about $14 trillion.
And then there is the euro zone watch. Investor concerns didn't disappear following the previous Friday's announcement of the results of stress tests on European banks. Most banks passed the tests, which were designed to gauge bank performance should European economic conditions worsen. But market watchers said they may not have been strenuous enough to be an accurate gauge of the perilous state of European financial markets. Last week the European leaders agreed to reduce Greeces debt burden in a last-ditch effort to preserve the euro and stem a broader financial panic. The pact is part of a rescue package of 109 billion euros, or $157 billion, for Greece, the most troubled economy in the euro zone. It will force many investors in Greek debt to accept some losses on their bonds. (No big surprise there.) The deal would also provide substantial debt relief for Ireland and Portugal. And by giving the main European rescue fund increased powers to assist countries that have not been bailed out like Spain and Italy leaders are betting that the program, described by some as a new Marshall Plan for Europe, will serve as a firewall against the contagion that has threatened to engulf some of the regions largest economies.
The tense situation on both sides of the Atlantic Ocean explains why the amount of gold held by exchange-traded funds, popular tools for investors to gain exposure to gold, reached a record high on July 22nd (previous Friday) at 2156.4 metric tons, according to Barclays Capital.
We expect that Republicans and Democrats eventually will strike some kind of debt-ceiling agreement to avoid default, although it probably will not happen until the last moment due to the political posturing. When that happens, there might be an additional correction in gold.
Nothing goes up in a straight line. After such stunning gains over the last few weeks the situation has become tense for gold. Any pull back could be a great buying opportunity for us. All we have to do is make sure we have freed-up capital to buy precious metals when they correct. This makes this analysis all the more meaningful.
We aim to be well prepared when a correction comes, so let's begin the technical part of this essay with the analysis of the yellow metal itself. We will start with the very-long-term chart for gold (charts courtesy by http://stockcharts.com.)
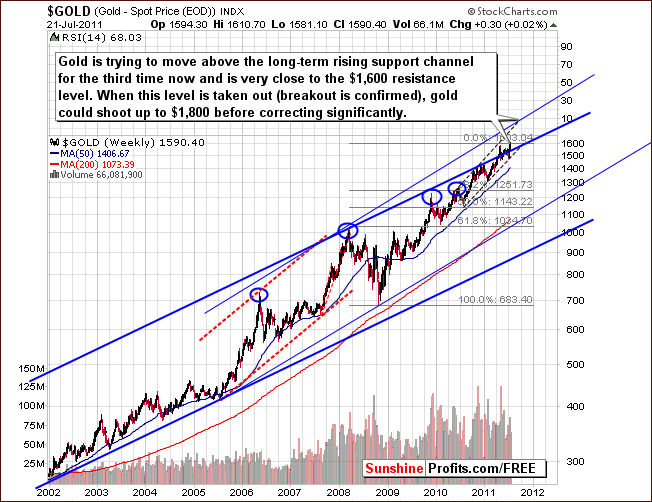
We see some important developments. On Monday, gold moved above the resistance level, and hit $1,613.5. The main question now is whether this confirms the breakout. In our last free essay we stated that the gold breakout was yet to be seen:
No breakout has yet been seen and our previous comments remain up-to-date. The situation continues to be quite similar to what we saw late last year (triple top) and it is clear that the consolidation at that time was quickly followed by a decline.
Even though gold moved up by 0.7% on Monday and finished above $1,610, we still believe this comment is up-to-date this move has not been confirmed neither by volume, nor by gold from the non-usd perspective.
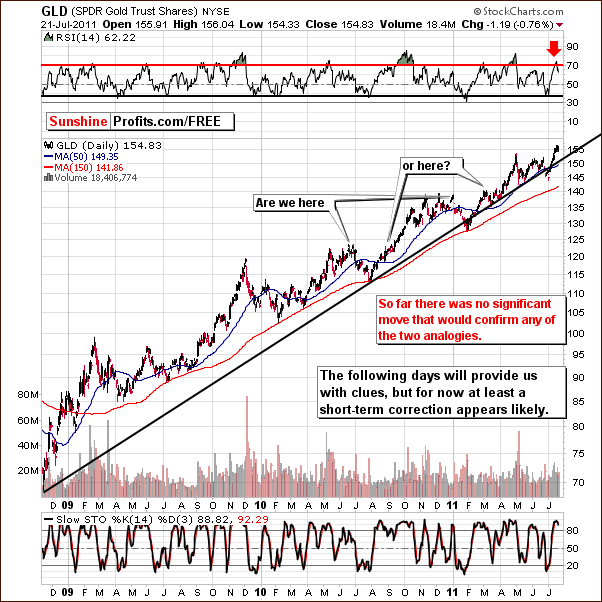
The situation remains somewhat unclear on the long-term GLD ETF chart with two possibilities on the table. GLD may either decline to the 50-day moving average (marked on the chart with Are we here) or decline insignificantly and rally afterwards (marked with or here?). Either way, at least a short-term correction still appears likely but what we have seen to this point is not enough to allow for a valid comparison to any particular point in the past and thus the correction does not appear to be over. It is simply a tough call at this time to identify which previous pattern is most likely to be repeated. The jury remains out.
As weve mentioned earlier in this essay, there was no breakout in gold from the non-USD perspective (the chart doesnt show the last few days, but there was no breakout in this time frame either) and gold stocks actually declined on Monday even though gold moved higher.
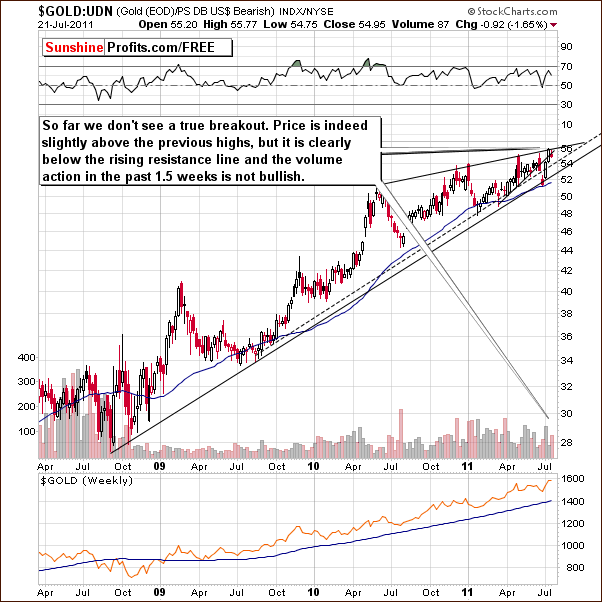
In fact, we have seen a pause as the recent rally reached the resistance level created by previous tops. We have not seen a breakout and the recent volume levels have been somewhat bearish. Recently, we have seen gold rally on low volume levels and decline on greater volume. This is a bearish development and when considered along with the pending resistance line, another rally from here is not a very likely scenario.
Finally, lets have a look at mining stocks. This week, were going to check take a look at this sector through the Gold Miners Bullish Percent Index.
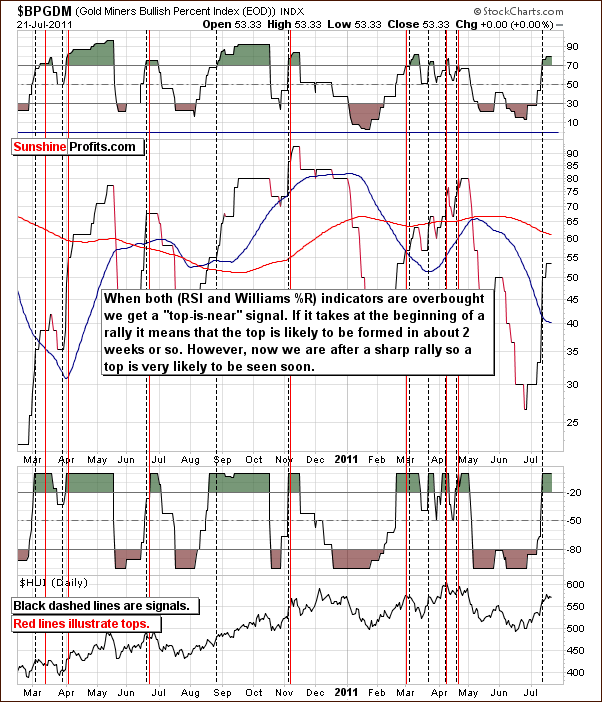
In the above chart we see the overbought (a.k.a. top is near) signals. The RSI and the Williams %R continue to warn that the top is near. At least a short-term correction is likely based on this information.
As a reminder, the above index is a market breadth/momentum indicator that is calculated by dividing two numbers: the amount of gold stocks on the buy signal (according to the point and figure chart, which emphasizes strong moves while ignoring small ones) and the amount of all gold stocks in the sector. After analyzing this index thoroughly we found that one of the best ways to approach it is to use RSI and Williams %R indicators when both are overbought then a local top is likely to be seen soon which is the situation today.
Summing up, the situation in the precious metals market is extremely tense with gold moving above its resistance level. However, as this movement is accompanied by bearish signs, it seems that the true breakout has not yet been confirmed. The situation in the mining stocks sector remains in tune, with a possibility of a top in the nearest future.
To make sure that you are notified once the new features are implemented, and get immediate access to my free thoughts on the market, including information not available publicly, we urge you to sign up for our free e-mail list. Sign up for our gold & silver mailing list today and you'll also get free, 7-day access to the Premium Sections on my website, including valuable tools and charts dedicated to serious PM Investors and Speculators. It's free and you may unsubscribe at any time.
Thank you for reading. Have a great weekend and profitable week!
P. Radomski
--
Times are truly tense for Gold Investors. We've recently been and we're going to be in the "red alert mode" on Tuesday (and in the following days) as well, as once again, a decisive move in either direction could confirm or invalidate a breakout - both of which will have profound implications going forward. We will keep our Subscribers informed.
Moreover, in the latest Premium Update we reveal when we believe the final bottom will be seen for the whole precious metals sector.
We encourage you to Subscribe to the Premium Service today and read the full version of this week's analysis right away.
