
This essay is based on the Premium Update posted on March 26th, 2010. Visit our archives for more gold articles.
In our previous essay we explained the link between the USD Index, and the price of gold and commented on what how is the situation on the USD likely to influence the precious metals market. This week, we would like to comment on the second driver of the PM prices - the general stock market. Much has been written lately how overvalued are the main stock indices at the moment, and how bad it is for the PM sector. Naturally, everyone has the right to believe that market is going to go in any direction, but based on how we read the charts, it seems that the main stock indices may not top very soon, and even if that is to take place, precious metals may still be able to rise.
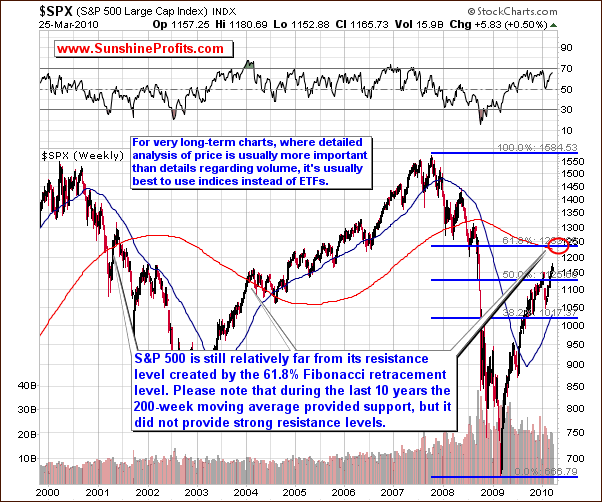
We would like to begin this part of the update with a very-long-term chart (charts courtesy by http://stockcharts.com) of the S&P 500 Index
One of the e-mails that we received this week included the information that the SPY ETF is right at its 200-week moving average, which - as it was stated in the message - is likely cause the main stock indices to decline. We would like to comment on that issue, because it allows us to explain how confirmations and non-confirmations work.
Before we start, please keep in mind that when doing detailed analysis of price action the very-long-term charts it is better to use the indices and ETFs based on them. The reason is that in the very long run, the value of the ETF may not properly represent the index - the small differences in movement between S&P 500 and the SPY ETF don't matter much on a day-to-day basis, but if they accumulate, then can distort the technical picture of the market. So, which one should you follow? Naturally, the decision is up to you, but we prefer analyzing the index itself than using its derivative (the ETF), if the latter doesn't provide us with additional information - for instance while analyzing smaller time-frames the analysis of volume is very important. So, since the underlying index doesn't confirm the signal, its strength is limited.
Therefore, when taking a look on the S&P 500 index we see that its value is currently visibly below its 200-week moving average. Moreover, even if that wasn't the case (and we were at the 200-week moving average), it would still not provide us with much information. The above chart points out that over the last 10 years the 200-week moving average used to provide support but did not provide strong resistance. This phenomenon is in fact visible also on the SPY ETF chart.
Another interesting thing is the way the value of the S&P 500 shaped in 2004 - please note that it broken through the 200-week moving average without a pause, and then stopped around the 2002 high. After this took place the S&P 500 found support at the 200-week moving average. Should that be the case also today, we might see further strength in the main stock indices followed by some kind of consolidation once it moves above the area marked with red ellipse.
In addition, the above chart shows that at current levels there is a lot of room before it hits its resistance level identified by the 61.8% Fibonacci retracement level. Naturally, it might be the case, that stocks move above this level and then verify it as support. Either way, this implies that a significant decline is not very likely at this point and the general market could rally further.
As mentioned earlier, PMs may be ready to rise even without a positive impact from the main stock indices. Based on the latest readings from our correlation matrix (available to our Subscribers) gold and gold stocks are now much more correlated with the USD Index than with the general stock market. Besides, the self-similar pattern present on the gold market suggests that higher prices of the yellow metal are very likely in the medium-term.
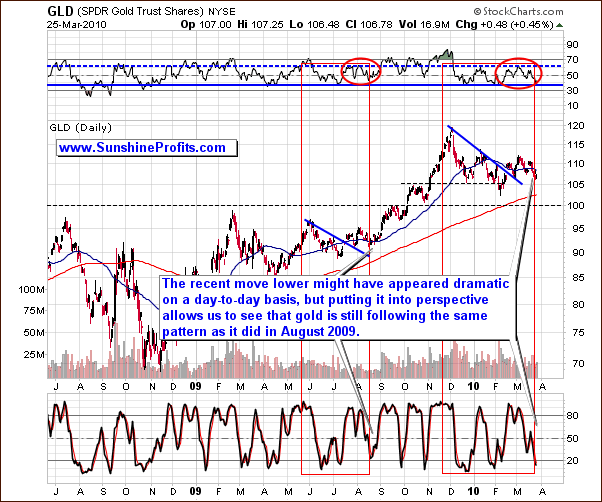
Little has changed this week in comparison to last week's gold analysis. This might seem a bit strange at first given that the recent moves lower might have appeared bearish when one observes the gold market on a daily basis. However, from a broader perspective it is still in the same pattern as gold was in August of 2009 before beginning a rally.
Using the Gold Trust ETF (GLD), which is a proxy for the gold market, the current stochastic level of around 20 and the RSI around 70 are also similar to the August 2009 pattern. In the past we have also came back to re-test the previous low, which has just taken place, further confirming our bullish analysis.
I realize one might perceive the last 6-week action as a bearish head-and-shoulders formation, but before opening short positions, please note that the August 2009 action was also similar to this pattern, and Gold managed to rally very strongly soon after that. Moreover - based on yesterday's closing price - the formation is not completed, as prices failed to move decisively below the late-February bottom. What's even more interesting, the value of the GLD ETF managed to move decisively above that low - which serves as a strong bullish signal.
Additional confirmation comes from our unique indicators.
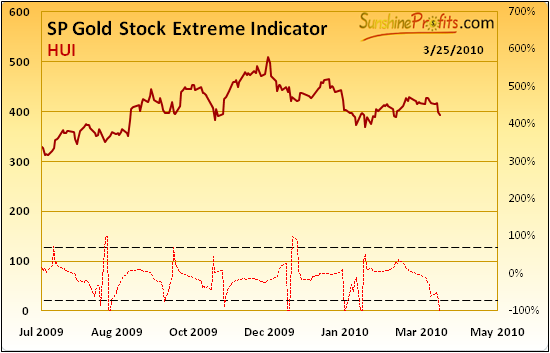
In the latest Market Alert, we mentioned that we have just seen a buy signal from the SP Short Term Gold Stock Bottom indicator, and we were very close to get one from one from the SP Gold Stock Extreme Indicator. In fact this is what followed. As a reminder, the above indicator provides an "extreme" reading whenever it crosses any dashed line in any direction. Given other points made in this essay, it seems that the "extreme" that has just been signaled is a bottom.
Summing up, the bullish analysis in gold is definitely still intact given the strikingly similar pattern in place back in August of 2009 where we had some consolidation followed by a significant rally. More detailed analysis and many additional charts are available to our Subscribers.
To make sure that you are notified once the new features are implemented, and get immediate access to my free thoughts on the market, including information not available publicly, I urge you to sign up for my free e-mail list. Sign up today and you'll also get free, 7-day access to the Premium Sections on my website, including valuable tools and charts dedicated to serious PM Investors and Speculators. It's free and you may unsubscribe at any time.
Thank you for reading. Have a great weekend and profitable week!
P. Radomski
--
This week we've seen significant developments in both general stock market (the rally paused) and the USD Index (rallied strongly) and in this update we address each of them. Naturally, we also cover the gold, silver, and PM stocks, from both long- and short-term perspective. In this issue we feature detailed analysis of 2 USD charts, 4 charts measuring the general stock market, 3 gold charts, 2 silver charts, 3 charts dedicated to PM stocks, two of our unique indicators, and more.
Last week's analysis of the very-long-term silver chart generated a lot of positive feedback, so this week we decided to provide you with analogous analysis of gold. As a result, we explain what may be in the cards for the coming months, and what shape is the next move in gold likely to take.
We also comment on the popular views that gold is within the bearish head-and-shoulders formation, and that the general stock market is to decline as the SPY ETF moved to its 200-week moving average. Additionally, we cover the signals coming from the analysis of the performance of PM stocks relative to other stocks and the ones from our unique indicators. We encourage you to Subscribe to the Premium Service today and read the full version of this week's analysis right away.
