
This essay is based on the Premium Update posted on June 11th, 2010. Visit our archives for more gold articles.
In our previous essay we have emphasized the importance of the analysis of the Euro Index, while evaluating recent performance of gold. We have also featured a gold chart that included a resistance level which gold has just approached. Since that was the case, you might be wondering if the final top is in or not. Consequently, this essay is going to feature the updated version of the previous gold chart (charts courtesy by http://stockcharts.com), with an additional important factor - areas marked on the below chart with blue ellipses.
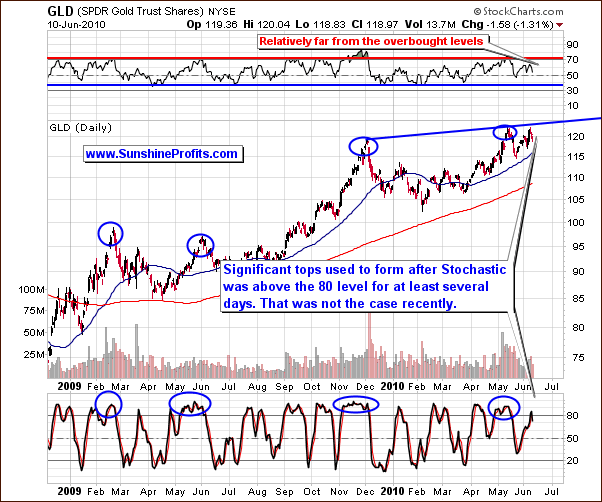
Please note how the recent local tops for gold coincide with the stochastic indicator above the 80 level. In other words, in the previous 18 months there was no significant top that was not heralded by Stochastic trading visibly above the 80 level. Today we do not see an extended (more than a few days) above the 80 level, which indicates an additional rally period is likely before the top is reached. It seems that the first thing to take place is the Stochastic indicator moving visibly above 80 and the rally then runs out of steam.
Consequently, based on this single factor, gold does not appear to have topped at this point. Let's take a look at the HUI Index for more details.
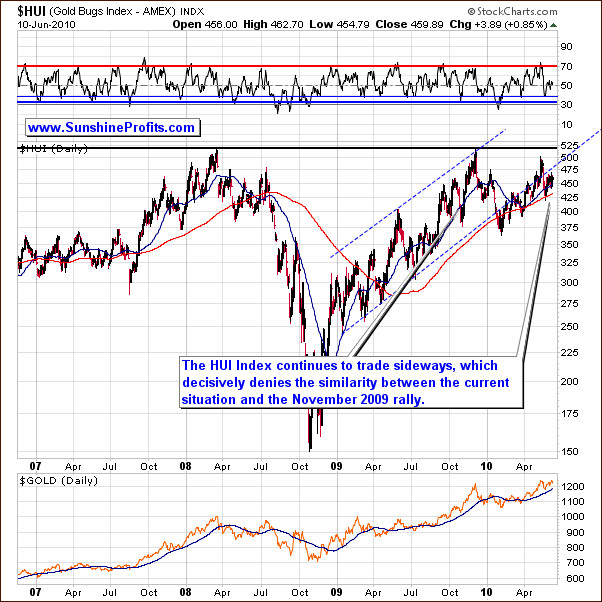
This week's HUI mining stocks chart is basically unchanged since the last week. Although it had appeared to be the case until about two weeks ago, there are virtually no similarities with recent trends and that which was seen in the November 2009 when a strong rally took hold and lasted for several weeks. The lack of strength in the mining stocks could mean that the rally in gold does not have much further to go from here.
There's one more thing that we would like to comment on this week before moving on to the short-term chart analysis. One of the messages that we've received recently included a question about the possibility of existence of the cup-and-handle formation with the cup being formed between Dec 2009 and May 2010. The implications of this would be bullish, because it would mean that we are right now in the "handle" stage, which - when completed - marks a beginning of a strong rally. This situation is even more visible on the short-term GDX ETF chart below.
Generally, we don't consider this to be the cup-and-handle pattern because of two important reasons. First of them is the shape of what would be perceived as "cup". It should be almost ideally U-shaped, and as we see the bottom was quite sharp. The second - and the key one here - is the non-confirmation form the volume. The corresponding volume should also be U-shaped, which means that the bottom of the cup should have been formed on the lowest volume in the Dec 2009 - May 2010 time-frame. The reality is that the bottom took place on huge volume, which is exactly the opposite of what one would expect from the "cup" pattern.
So, the HUI Index chart does not provide us with clear medium-term bullish signals at this point.
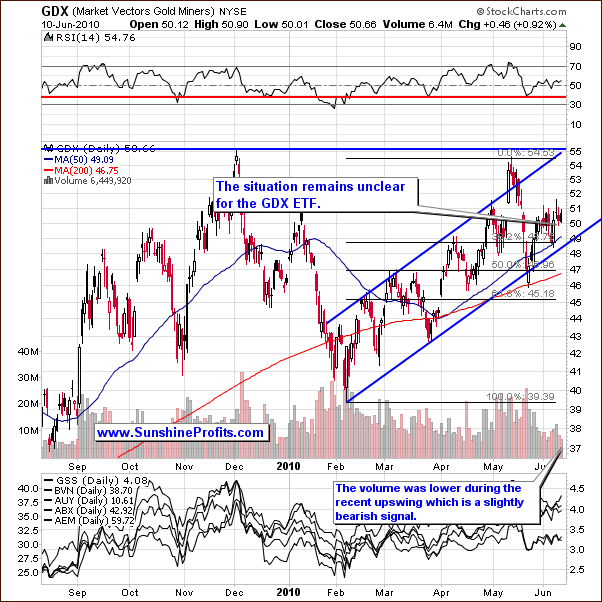
A closer inspection of the above chart shows a slightly higher volume daily decline followed by a lower volume rise on a recent trading day. This is normally a bearish sign but may also simply be attributed to consolidation.
Although a slight increase may be seen for the precious metal sector soon, this will likely be offset by any downward movement in the general stock market. This negative influence could more than negate any minor rally for precious metals. However, when the general stock market bottoms out, the negative correlation of the PM sectors could possibly result in a huge catch up rally for silver and mining stocks. This may mean a smaller decline instead of a bigger rally, but it's too early to say at this point.
At this writing, gold and silver stocks continue to be slightly positively correlated with the general stock market. The situation on the latter is slightly bearish, and at the same time we have bullish signals from gold.
Another confirmation comes from the analysis of the GDX:SPY ratio.
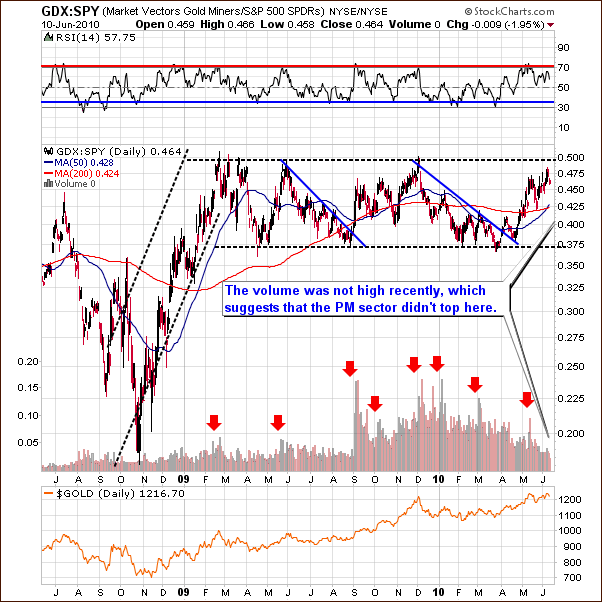
The GDX:SPY helps us to analyze the precious metals stocks' performance relative to the general stock market. The ratio in the above chart actually provides us with top calls,which is another word for sell signals for the whole precious metals market.
Ideally, the volume would reach exceptionally high levels (resistance level) and some kind of resistance would be encountered, thus forming the top also in this particular ratio. Recently, however, neither is yet the case. We have not seen high volume levels and we are presently close to the month-to-month 0.5 support level. This means that when this level is reached one share of the SPY ETF is equal to two shares GDX. When gold and silver stocks are this high - relative to other stocks, it used to be advisable to get out of the market as the top was very close.
Still, we have not seen the ratio reach the 0.5 level yet, and it did not provide us with a sell signal in the form of very high volume. Therefore, the analysis of the GDX:SPY ratio suggests that the final top has not yet been reached for the precious metals sector
Summing up, due to numerous unclear signals and lack of clarity with respect to the general stock market (slightly bearish sentiment), we conclude that the risk/reward ratio for mining stocks is not favorable enough to enter speculative trades at this point.
To make sure that you are notified once the new features are implemented, and get immediate access to my free thoughts on the market, including information not available publicly, I urge you to sign up for my free e-mail list. Sign up today and you'll also get free, 7-day access to the Premium Sections on my website, including valuable tools and charts dedicated to serious PM Investors and Speculators. It's free and you may unsubscribe at any time.
Thank you for reading. Have a great weekend and profitable week!
P. Radomski
--
The USD Index and gold moved slightly lower in the past few days, while stocks moved relatively higher - does this mark a significant change in the previous trends, or was this just a small pause? In addition to providing you with extensive answer to this question, we discuss gold role as an inflation hedge, and the meaning of the current divergence between gold, silver and mining stocks. We also explain, which part of the precious metals market is currently most appealing to precious metals Traders.
Additionally, we explain how one can secure one's portfolio against sudden decline in the U.S. Dollar, and we make practical suggestion for Investors, who fear that their speculative gains in mining stocks are going to be wiped out by dollar's collapse.
This week's update includes 19 charts/tables including i.a.: the USD Index, the Euro Index, general stock market, gold, silver, the HUI Index, GDX ETF, precious metals correlation matrix, the Broker-Dealer Index, and the GDX:SPY ratio. Additionally, this week's Premium Update includes the ranking of our top gold, and silver juniors.
We encourage you to Subscribe to the Premium Service today and read the full version of this week's analysis right away.
