
This essay is based on the Premium Update posted November 20th, 2009. Visit our archives for more gold articles.
Let me begin this week's essay by quoting a part of last week's update, in which I mentioned that the regular interpretation of the trend channel in gold might be misleading this time:
Still, there is a specific phenomenon in the technical analysis that I've noticed during my observations - when a pattern becomes "evident" so that everyone and their brother sees it and are able to act upon it, the price does exactly the opposite to what it is expected to do. There is a good reasoning for that to take place. Once everyone takes action on a particular signal (for instance they sell before a breakdown), there is nobody left to sell anymore, and as price fails to move decisively lower, investors buy back and fuel another rally. In most cases it is very difficult to estimate if a pattern is "commonly known" or not, but the current trend channel is rather evident, so its reliability is a little lower.
Consequently, gold has broken above the rising trend line on Monday and did not move back below it so far. Therefore, it doesn't surprise me to see many messages in my e-mail inbox from Investors, who are out of the market and they are afraid that gold will never look back from now on and that it will keep rising in the foreseeable future. However, this is a small clue that this is not the case yet, and that a correction is coming rather soon. The price of gold broken above its resistance, and the breakout was confirmed by a few consecutive closes above this level, but is this enough to suggest that another strong rally will begin even without a small breather? Let's turn to gold chart (charts courtesy of http://stockcharts.com) for details.
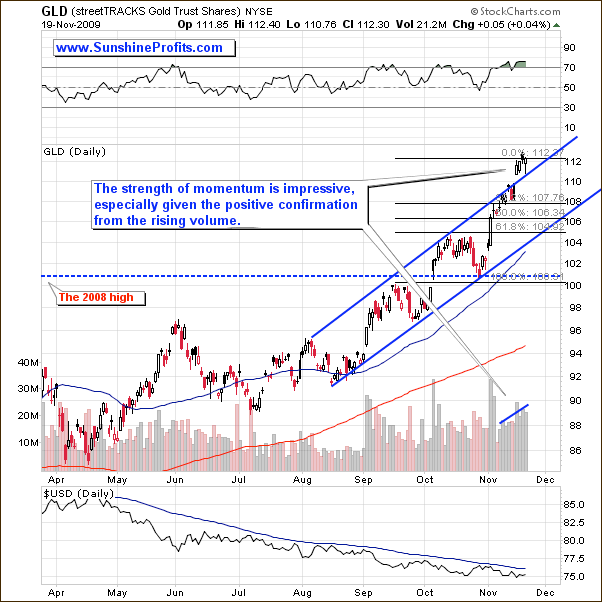
The short-term resistance level, created by multiplying the distance between two previous tops by 1.618, has been hit on Wednesday. Yet, the price did not reverse immediately. Instead, it moved to the previous resistance and verified it as a support by moving higher after touching it on an intra-day basis. Moreover, the volume has been rising during the past two weeks, which is a confirmation of the move - in other words, it suggests further gains in the short-term, not a plunge. Naturally, a sell-off might materialize even despite the lack of warning signs from volume, but this is not what is a likely outcome. Therefore, gold might move even higher (not necessarily today) before correcting in a more meaningful way.
Before moving on to the analysis of the USD Index, I would like to comment on the recent developments on the non-USD chart of gold (gold:UDN ratio). UDN is the symbol for PowerShares DB US Dollar Index Bearish Fund, which moves in the exact opposite direction to the USD Index. Since the USD Index is a weighted average of dollar's currency exchange rates with world's most important currencies, the gold: UDN ratio means the value of gold priced in "other currencies". It trades similarly to the USD/EUR currency exchange rate.
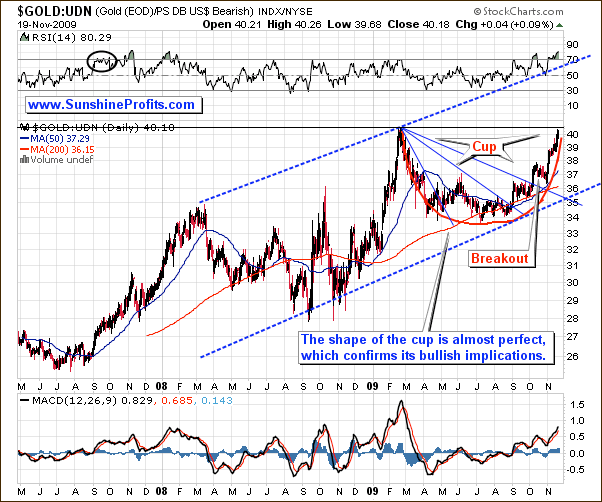
In the October 16-th Premium Update I wrote that gold didn't break above its previous high in the recent months, but that is not the same high that one looks at when viewing the price of gold in the U.S. Dollar. The March 2008 high that was the top that gold broke above in USD, but taking other currencies into account - it has already broken this level in January. Consequently, the non-USD gold chart differs from its USD counterpart but is just as bullish. After all, price broke higher almost a year earlier and has verified that breakout a few times over several months, which means that it is now set to rise higher, most likely above its 2009 high.
After breaking through three resistance levels, the non-USD price of gold finally managed to form a meaningful rally, which took it to its previous high. It may or may not move above it at this time, but that is not the most important implication here. The key observation here is that we can see a clearly visible, substantial, multi-month "cup" from the cup-and-handle formation. The exciting part is that the more U-shaped the cup is, the more bullish the formation gets, and the cup on the chart above is almost perfect. The value of the ratio may stop at its previous high, especially given the overbought RSI indicator, but once the consolidation is over (and the "handle" is formed), the non-USD price of gold is likely to soar.
While commenting on the metals market, it is always useful to feature the USD Index chart. After all - it is the currency metals are priced in. Let's begin with the long term chart.
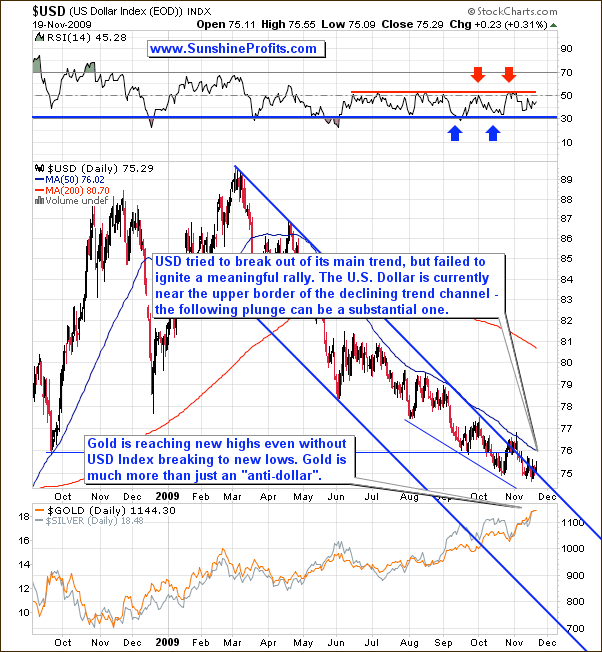
There are no big changes in the long-term USD chart, since I've covered it deeply in the October 30th Premium Update (click to read it - it's now available as a sample version). The trend is still down. Dollar tried to ignite a rally in late October that was supposed to end the decline, but didn't manage to do anything more than just to create a fake-out bearish signal. The value of the USD Index is still trading sideways near the upper border of the trend channel, which makes a substantial plunge quite possible - a move to the lower border of the channel would mean a massive decline, much below the 70 level.
Let's zoom in for more detailed view.
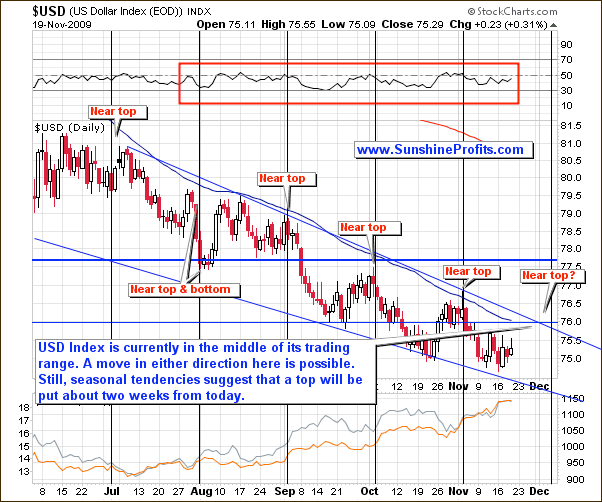
The short-term chart reveals dollar's cyclical tendencies (black vertical lines) that mark moments close to local extremes (mostly tops, though). Should this pattern repeat once again (and it is likely, given how many times it worked in the past), we might see a local extreme in the USD Index early in December, and trading sideways until that time. It's too early to say if that would be a top or bottom, but I will get back to this topic once we move closer and have more information. For now, it seems that PMs might rise/decline rather regardless of the short-term action in the U.S. Dollar. Please take a look at the correlation table below.
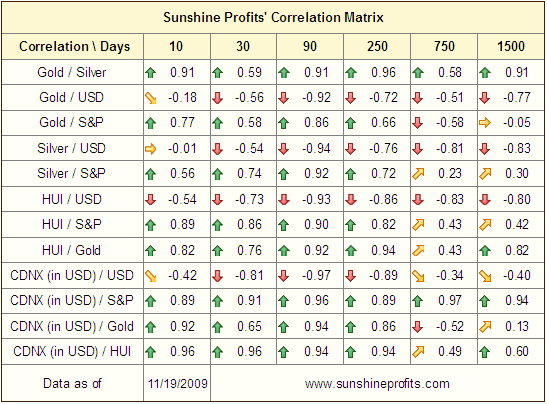
Although the 10-day column is not statistically significant, and is just a very rough estimation, it provides us insight into what tendencies might change in the very near future. In this case, the low values of correlation coefficients for gold/USD (-0.18) and silver/USD (-0.01) suggest that these markets are now more or less moving "on their own", and a catalyst from the USD Index is not needed to ignite a rally, nor plunge.
Summing up, based on this week's price action, it seems that gold may need to move higher before correcting in a meaningful way. The key driving markets for precious metals, USD Index and the general stock market don't provide decisive signals, and the former has been recently trading rather independently from PMs, so it may not be needed to ignite a rally or a sell-off in the metals. Once the looming correction is complete, the following rally can be quite spectacular, as precious metals stocks are becoming less dependent on the main stock indices, and the non-USD gold price formed a massive cup from the very bullish cup-and-handle pattern. If the rally is to be profound even not taking U.S. Dollar's plunge into account, then the value of the yellow metal in USD can increase even more significantly from the "regular, USD perspective".
The full version of this update is about 4x bigger than the free version and contains many additional charts with critical analysis. Things covered in this week's Premium Update include the in-depth analysis of gold (long-, medium-, short-, and non-USD perspective), silver, USD and its cyclical tendencies, main world stock indices, long-, and short- term analysis of precious metals stocks along with their relative performance to other equities, and platinum. Additionally, I comment on the evidence that the smart money is in PMs right now, and explain how it can make sense to enter the market and exit it at the same time. Subscribe now, and find out why $7000 gold and $400 silver aren't really irrational!
To make sure that you are notified once the new features (like the newly introduced Free Charts section) are implemented, and get immediate access to my free thoughts on the market, including information not available publicly, I urge you to sign up for my free e-mail list. Sign up today and you'll also get free, 7-day access to the Premium Sections on my website, including valuable tools and charts dedicated to serious PM Investors and Speculators. It's free and you may unsubscribe at any time.
Thank you for reading. Have a great and profitable week!
P. Radomski
--
While the previous Premium Update was the biggest one that I've created so far, this week's issue in almost virtually just as big! Does $7000 gold and $400 silver sound irrational? While there are no guarantees that PMs would go that high, these levels should help put the current comments about gold being overvalued, into proper perspective. Apart from price/time details of the coming tops in gold, silver, and PM stocks, I also comment on the the correlations between USD/PMs, and PM stocks / general stock market, and how they might change in the future.
Other things covered in this week's Premium Update include the in-depth analysis of gold (long-, medium-, short-, and non-USD perspective), silver, USD and its cyclical tendencies, main world stock indices, long-, and short- term analysis of precious metals stocks along with their relative performance to other equities, and platinum. Additionally, I comment on the evidence that the smart money is in PMs right now, and explain how it can make sense to enter the market and exit it at the same time.
