
Based on the February 10th, 2012 Premium Update. Visit our archives for more gold articles.
There is a study published by the Credit Suisse and the London Business School that says that gold prices have been too volatile to play a reliable role as a hedge against inflation over the past 112 years.
While inflation does not reduce gold's real value, it has no yield or income flow and the precious metal has given a far lower long-term return than equities in the period since 1900, or 120 years, says the study. Generally, the analysis is conducted based on periods when gold was money and where it was not and we believe that these two should not be mixed.
We realize that gold does not give income or interest. People invest in gold is a search for yield through capital appreciation or as a safe haven or as money. When interest rates are close to zero or negative in real terms, gold begins to glimmer. The US, Europe, the UK, China, India, golds biggest markets, all have negative real interest rates. It is true that the past 112 years have not all been good for the yellow metal. Yes, there are bull markets and there are bear markets and we are in the midst of a bull market in gold right now.
In the period since 1900, gold gave a real return of 1.1 percent in sterling terms and its value fluctuated widely, said the study. "Gold is the only asset that does not have its real value reduced by inflation. It has a potential role in the portfolio of a risk-averse investor concerned about inflation," it said. "However, this asset does not provide an income flow and has generated low real returns over the long term. Gold can fail to provide a positive real return over extended periods."
True. Thats why we are invested now, while gold is in the midst of a bull market. When it swings into a bear market well consider other options or perhaps evaluate the profitability and risk of trading the downswing impossible to tell at that point. However, the key issue is that one does not have to be fully invested in the precious metals sector during bear markets what is the assumption of the study.
Mohamed El-Erian, CEO and co-chief investment officer of bond fund giant PIMCO, said that given the fragile global economy and geopolitical risks, investors should be underweight in equities while favoring "selected commodities" such as gold and oil.
Obama seems to have run into a good streak of luck in his bid to get reelected president. Just in the nick of time, the U.S. economy is improving, at least as evidenced by last Fridays jobs report. Payrolls numbers are up by 243,000 jobs. Unemployment is down to 8.3 percent.
The Sunshine Profits Team extends our best Valentines Day wishes. To see if youll fall in love with the precious metals sector again, let's begin the technical part with the analysis of the yellow metal. We will start with the very long-term chart (charts courtesy by http://stockcharts.com.)
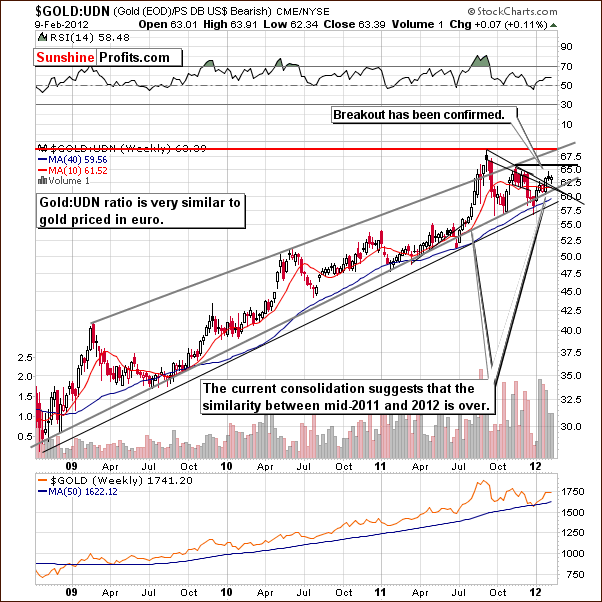
We begin with the chart of gold from a non-USD perspective. Last week there was a weak consolidation from a non-USD perspective and the strong similarities to the trading patterns of mid-2011 are no longer in place. With these developments, it is unlikely that a move to the upside will be as sharp this time. We have seen two consolidations this time and last year there was only one small stop, after which golds price immediately shot upward. This chart suggests that a sharp rally is not a likely probability and that further consolidation is quite possible at this time.
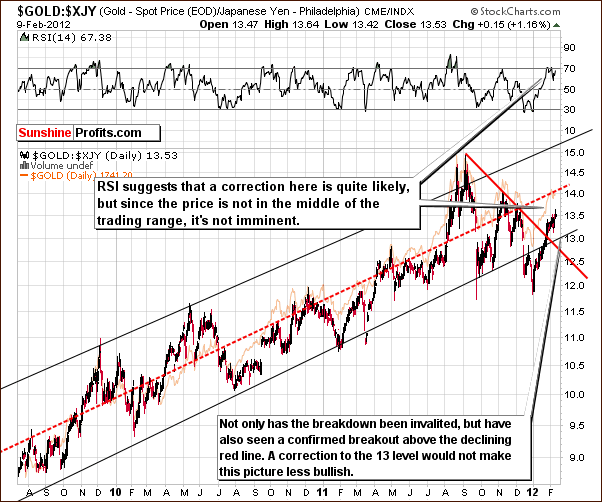
In the long-term chart of gold from the perspective of the Japanese yen, we see that the RSI level over 60 and this suggests that the local top may be in or is at least close. In the past, when the RSI held close to the 70 level for some time, local tops have been seen. Such is the case today. Prices are also close to the middle of the trading range but not at it, so a pause appears likely though not yet imminent.
So, will gold decline from here? Most likely yes, but not very far. The additional confirmation of the short-term bearish case comes from the general stock market, as gold has been recently moving in tune with stocks. Consequently a turnaround in stocks could ignite a move lower in gold as well.
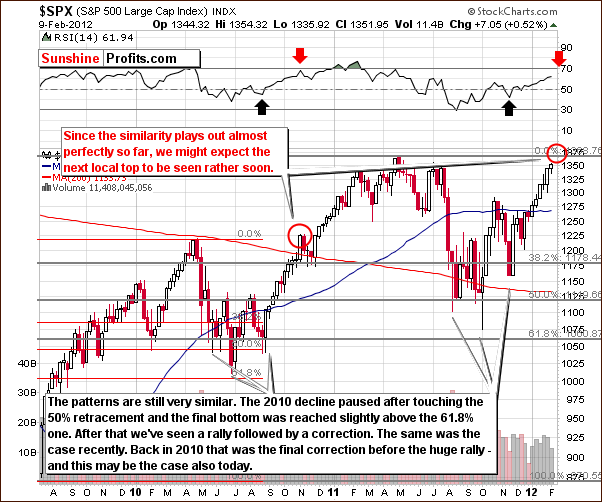
The next local top in stocks will probably be close to the level of the 2011 high. The recent trading pattern has been consistent with the period leading up to the local top in 2010-11. In October-November 2010, declining prices were seen for a few weeks but were quickly followed by a continuation of the rally. We may have a similar situation here.
RSI levels should be looked at as well and are also indicating that a rally is likely ahead. It appears that it could last for two to four weeks as the RSI level will then likely be close to 70. This has coincided with local tops in the past.
The short-term (and short-term only) bearish case for gold is further confirmed by the actual recent action in the silver market which has followed what we outlined in our essay (February 10th, 2012) on the likely silver pullback:
Silvers price has been in a sideways trading pattern during the past two weeks after a strong rally in which the red support-resistance line was pierced and volume levels were significant. With silver now above this line, it seems that a move back to it, a test of the breakout may in fact be seen. The 38.2% Fibonacci retracement level based on the 2002 to 2011 rally is also in play and will likely assist in stopping a decline as well.
( ) the medium and long-term outlook for silver remains bullish but also based on the analysis of the USD Index the short term is now more bearish than not.
Summing up, the outlook for gold remains bullish for the medium and long term but is now rather bearish for the short term.
To make sure that you are notified once the new features are implemented, and get immediate access to my free thoughts on the market, including information not available publicly, we urge you to sign up for our free e-mail list. Sign up for our gold & silver mailing list today and you'll also get free, 7-day access to the Premium Sections on my website, including valuable tools and charts dedicated to serious PM Investors and Speculators. It's free and you may unsubscribe at any time.
Thank you for reading. Have a great and profitable week!
P. Radomski
--
Mining stocks have been declining since a few days and it seems that metals started to follow today. In today's Premium Update we compare the current situation to the previous - very similar - pattern to see how low might gold, silver and miners go. Combining this approach with other techniques (like analysis of volume and correlation coefficients) allows us to provide price targets for GLD, SLV and GDX ETFs.
Meanwhile, the USD Index paused its decline and in today's issue we indicate whether a rally or decline is likely to follow. We noticed and analyzed an important phenomenon regarding USD Index and gold. Additionally, we covered the situation in the platinum market and the Gold Miners Bullish Percent Index.
Moreover, we commented on investors' assumption that low interest rates will take stocks higher, implications for long-term silver investors, Greece's debt deal, and we explained our methodology regarding the cyclical analysis.
We encourage you to Subscribe to the Premium Service today and read the full version of this week's analysis right away.
