
Gold & Silver Trading Alert originally sent to subscribers on December 10, 2014, 8:27 AM.
Briefly: In our opinion no speculative short positions in gold, silver and mining stocks are currently justified from the risk/reward perspective.
Gold soared yesterday as the USD Index declined. More importantly, gold broke above the short-term declining resistance line and above most recent highs. Is there still any chance that we will see a move below $1,100 before the next big rally is underway?
We think so. While the price action in gold alone is bullish for the very short term (not necessarily for the medium term) and the situation in the USD Index suggests that we will have bullish implications for gold in the coming weeks (even if that doesn’t happen right away), many other markets and ratios point to lower prices suggesting that the most recent rally is just a regular correction.
We have a lot to show you today, so let’s jump right into charts (charts courtesy of http://stockcharts.com).
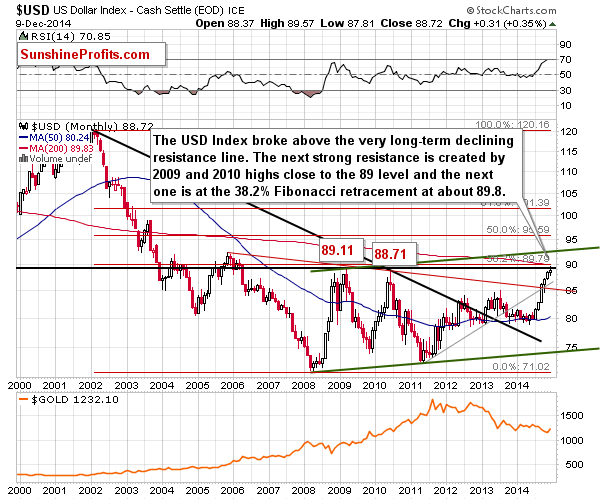
Our previous comments on the above chart remain up-to-date, but we decided to keep this chart in today’s analysis as it provides important context:
The long-term picture is the key thing to keep in mind at this time, as it is the long-term resistance level that was just reached. This week, the USD Index moved above both the 2010 high and the 2009 high, which means that there are good reasons for the index to decline sooner rather than later. We saw a decline just yesterday, but at this time it’s not completely clear that the top is already in. We could still see a move to the 38.2% Fibonacci retracement level based on the entire 2002 – 2008 decline [at about 89.80]. This means that we are likely to see a corrective downswing relatively soon, but not necessarily right away.
The USD Index moved higher on Friday and Monday (the intra-day high was 89.57), so it’s now very close to the resistance. The potential for a further rally is limited at this time.
Let’s keep in mind that there is still the possibility that the USD Index will rally to the 2005 high or the rising green resistance line (in this way, the current rally would match the 2008-2009 one).
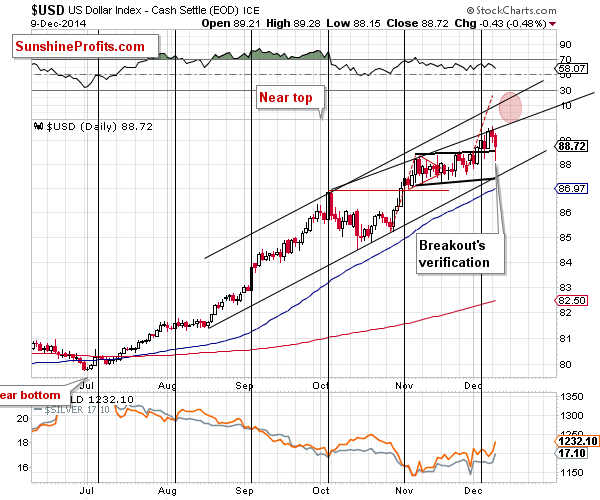
The USD Index declined to the upper border of the previous flag pattern without moving below it. At this time, the short-term outlook remains bullish - yesterday’s big (on a day-to-day basis) decline didn’t change anything (at the same time, the potential for a further rally remains limited).
In the previous alerts we wrote: gold has held up relatively strong in the recent weeks, which makes it even more likely to move higher if the USD Index declines – and the latter is likely to decline relatively soon.
Gold indeed replied positively to the dollar’s daily decline yesterday. However, with the breakout above the flag pattern being verified, the next short-term move could be to the upside, which would likely cause gold to decline. Plus, gold is close to it’s medium-term resistance line, so it’s now much less likely to rally and perhaps the corrective action is about to be over.
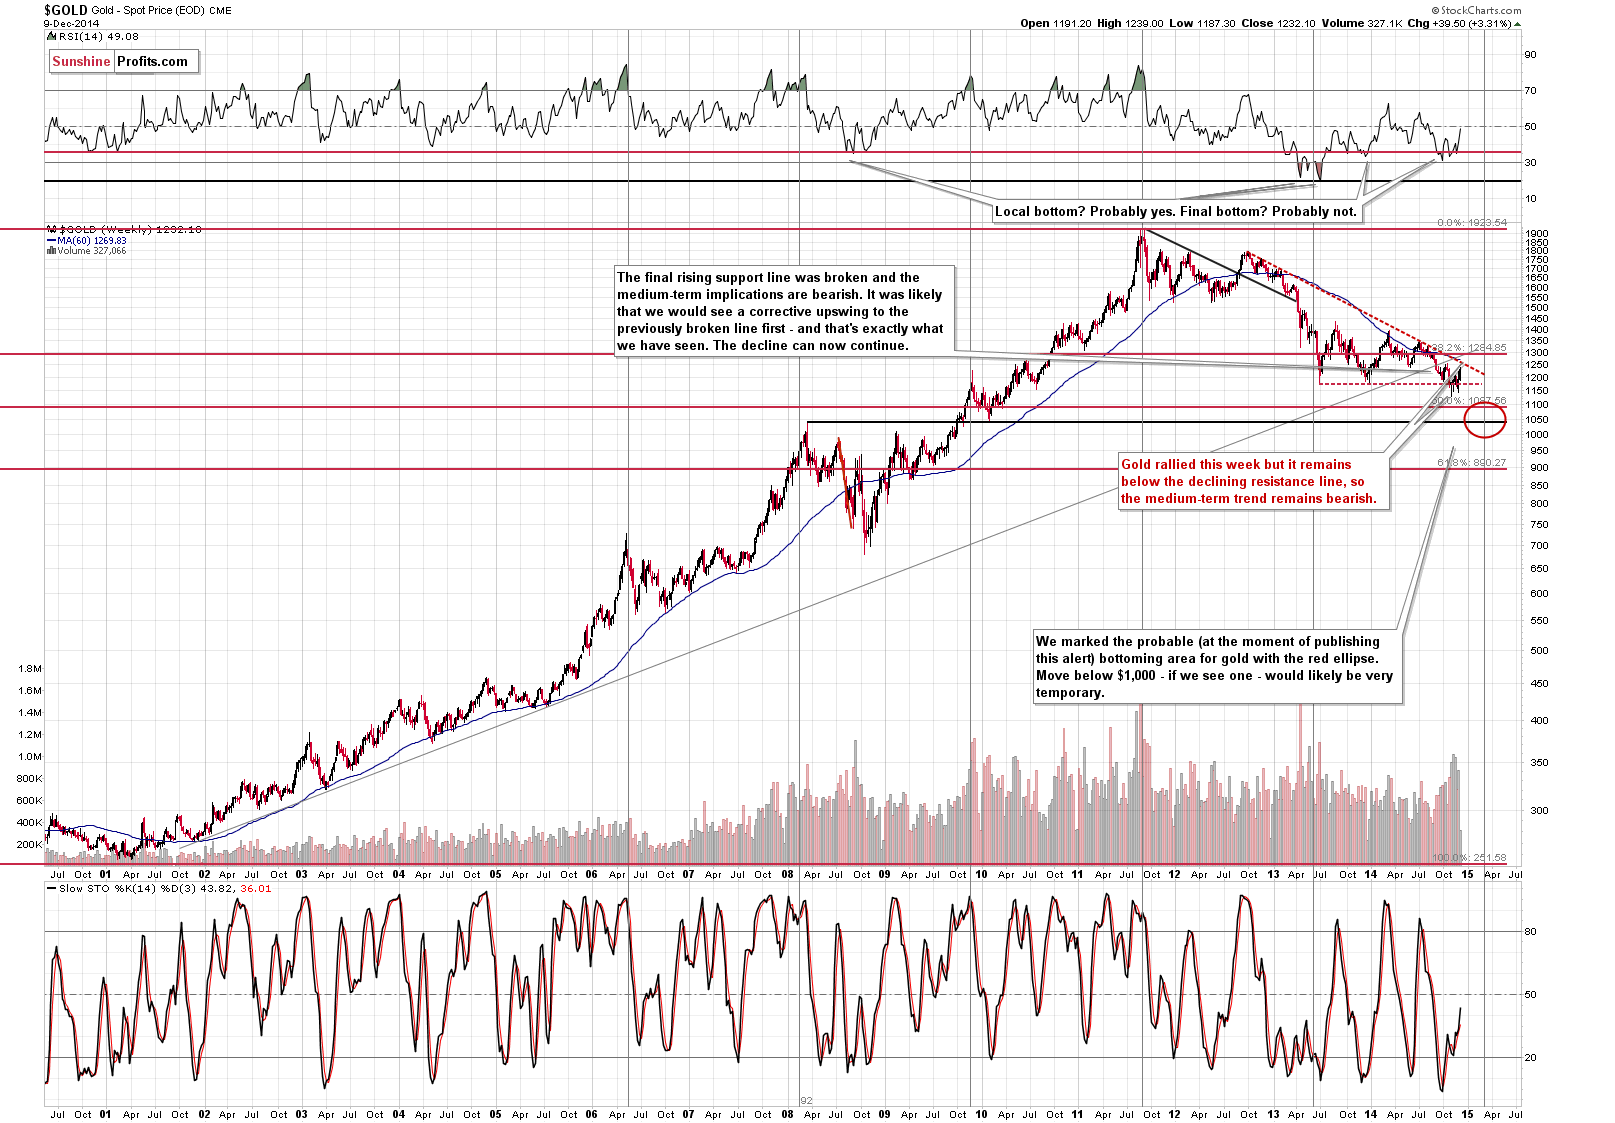
On the long-term gold chart we clearly see that the declining medium-term resistance line was not reached as it’s currently at about $1,250. Consequently, the recent rally didn’t change much, if anything, as far as medium-term implications are concerned and the outlook remains bearish and our downside target remains valid. Please note that the very long-term turning point goes through the middle of our target area, which makes it more probable that we will indeed see a major turnaround at this time. In previous cases the extremes that accompanied these turning points were major ones.
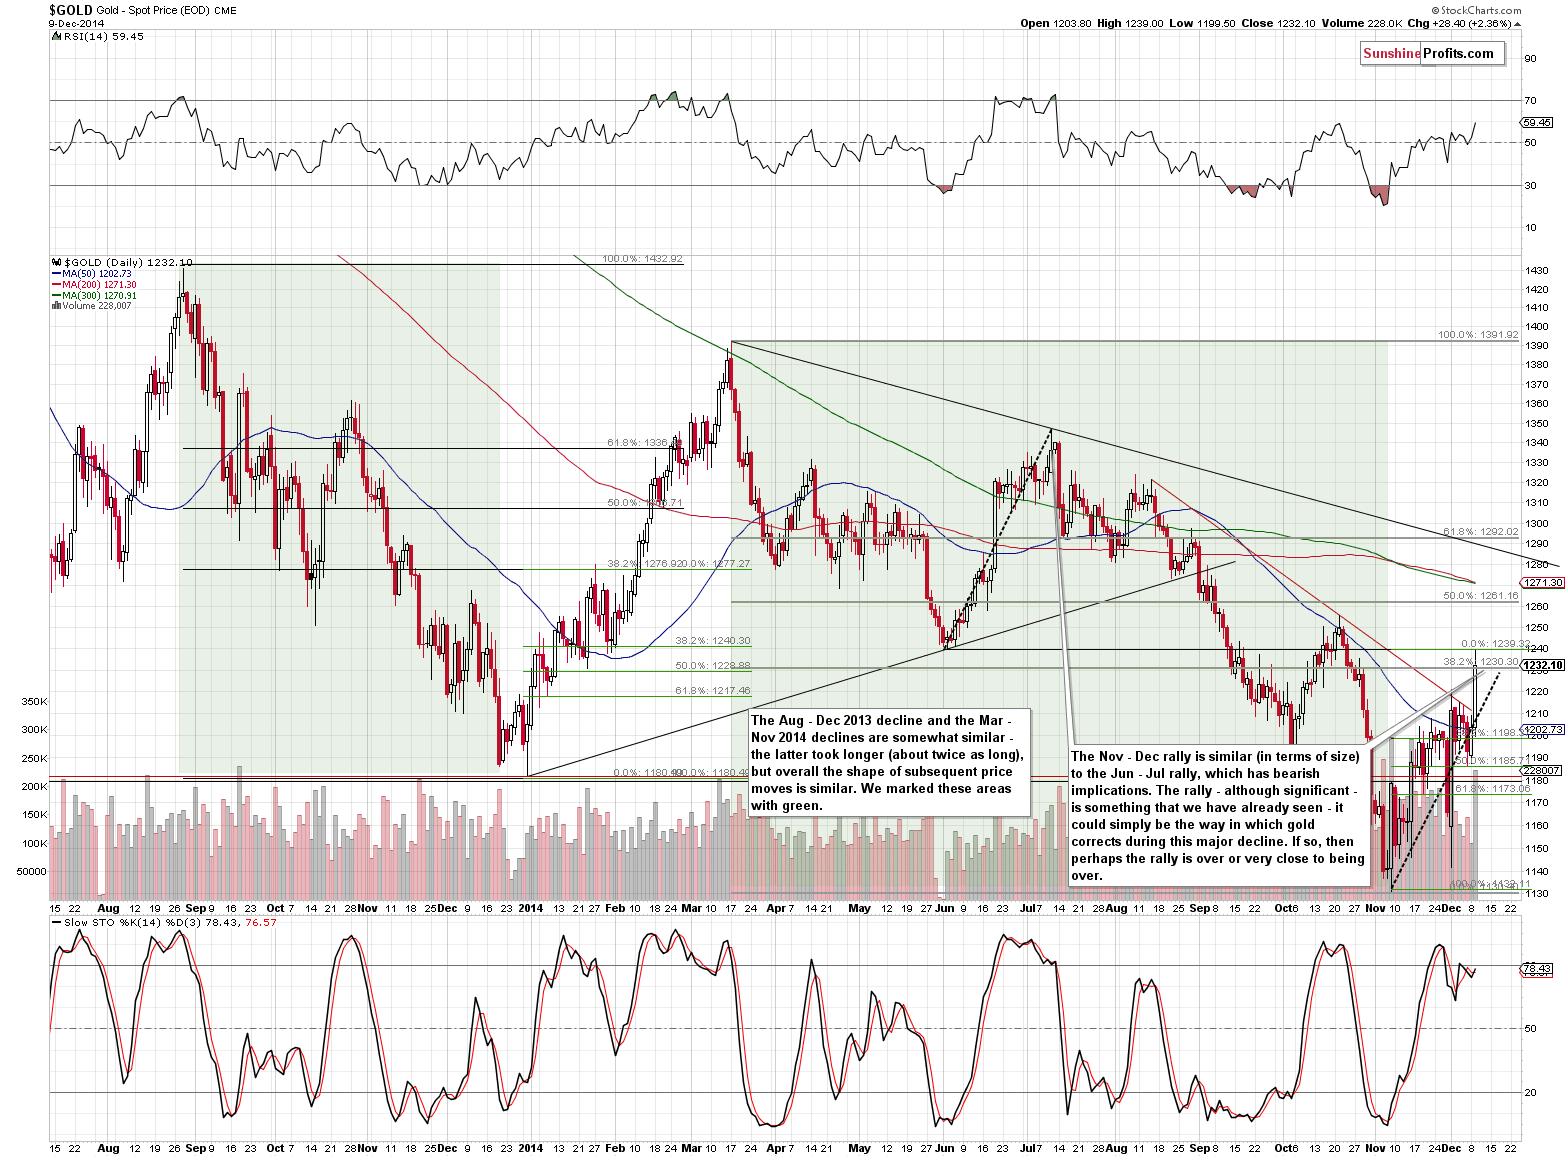
As we mentioned earlier, there are some bullish signs. The short-term chart provides an explanation. As you know history tends to repeat itself in a more or less clear way. When we compare the previous 2 declines in gold (marked in green on the above chart), we’ll see that their shape is more or less similar, with the second rally being stretched in time. In both cases there is a bigger corrective upswing right before the middle of the decline and there is also a smaller correction right before the end of the decline.
Before we move further, it’s important to keep in mind that the previous bottom took place at the end of 2013. We’ll get back to it in a few paragraphs.
If these patterns are indeed similar, then perhaps what followed previously will be what we are about to see next. The analogy to the current situation could be found by looking at gold’s performance in January 2014, close to the yellow metal’s 50-day moving average. This would mean that we are about to see some sideways trading. After that, we could see a sizable rally.
Before jumping into the gold market, let’s keep in mind that the long-term picture is more important than the short-term one. Consequently, even though there is an analogy on a short-term basis, it doesn’t have to have meaningful implications, simply because the long-term picture favors a different outcome.
The reason we are describing the above is that we want you to have a better picture of what the different possibilities are. Understanding that there are multiple factors of different strength affecting both sides of the market at this time should be helpful in remaining unemotional about the upcoming move. Not all moves can be forecasted and at times it’s better to stay out of the market, but when one starts to depend on their emotions in trading, the odds are turning against them, because it is exactly this that makes traders buy at tops and sell at bottoms – it’s easy to do emotionally (as everyone else is buying or selling, respectively).
Let’s move to other factors that are currently in play.
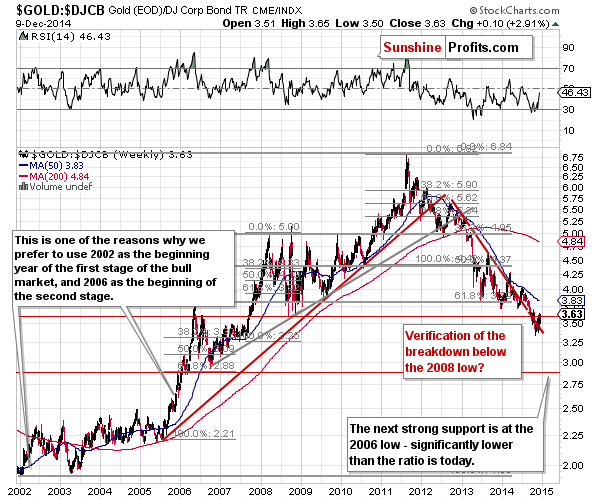
Moving back to the long-term outlook, we see that the move higher in gold to bonds ratio was very small. It was just a correction after a breakdown below the 2008 low, which was not invalidated. The implications are bearish for the medium term but rather nonexistent for the short term.
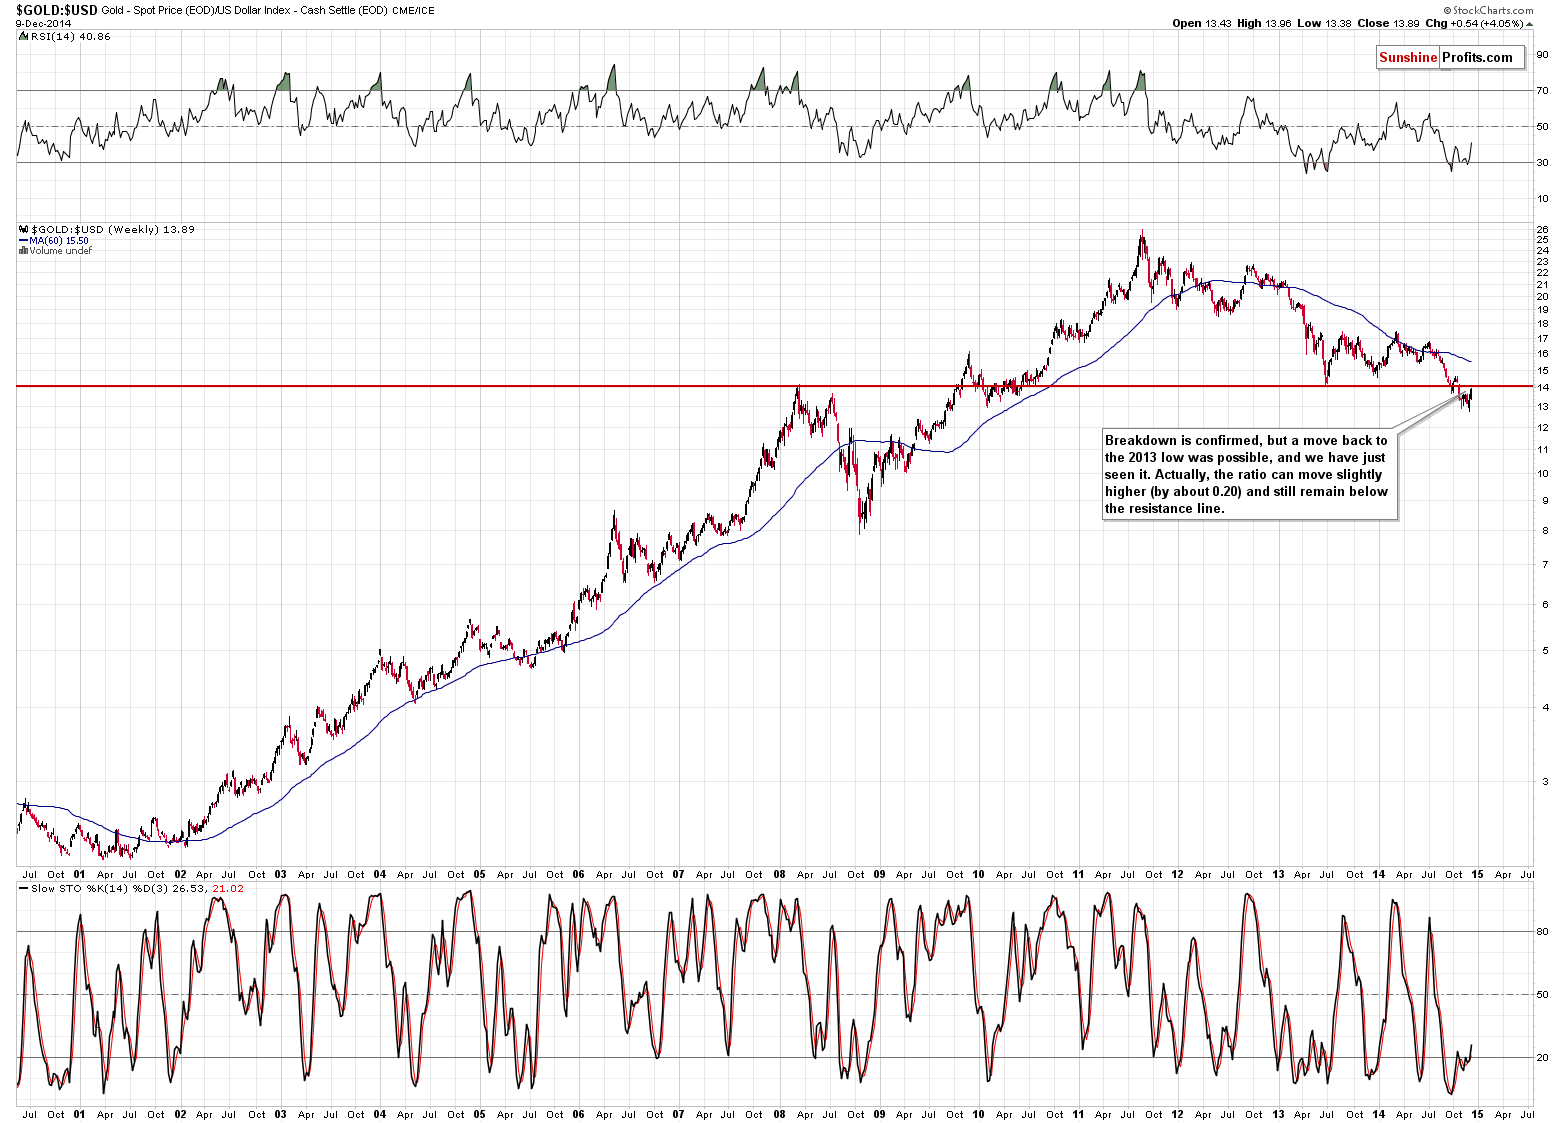
The gold to USD Index ratio has previously broken below an important and clearly visible support level – the combination of the 2013 low and the 2008 high. The above is now resistance and, as we had written several times previously, there was a good possibility that we would see a correction to this level. It seems that we are seeing it right now. The resistance hasn’t been reached yet, it’s about 0.20 above the current value of the ratio, so we could see another (rather small) move higher in the following days, but this could mean the end of this rally.
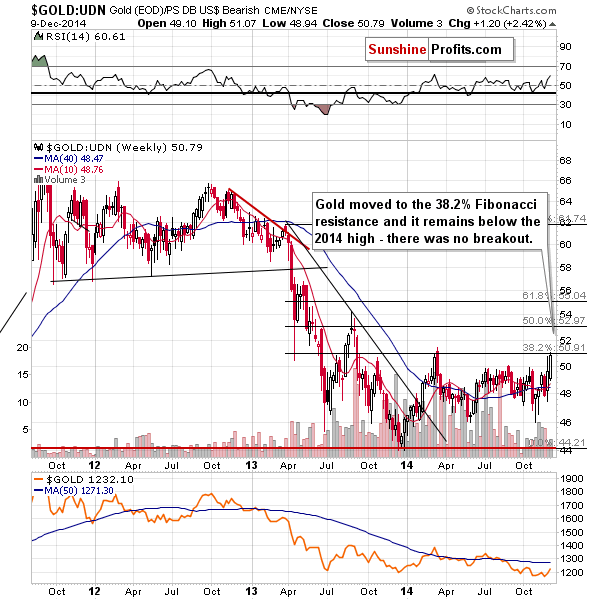
Gold seen from the non-USD perspective moved to a resistance created by the 38.2% Fibonacci retracement level (based on one of the lower 2012-2013 local highs) and it’s just a little below its previous 2014 high. From this perspective, the implications are bearish as the move higher seems to be nothing more than just a correction and the bigger trend remains down. Since the resistance was reached (or is about to be reached in the case of the 2014 high), we could see a local top relatively soon.
Let’s move to silver.
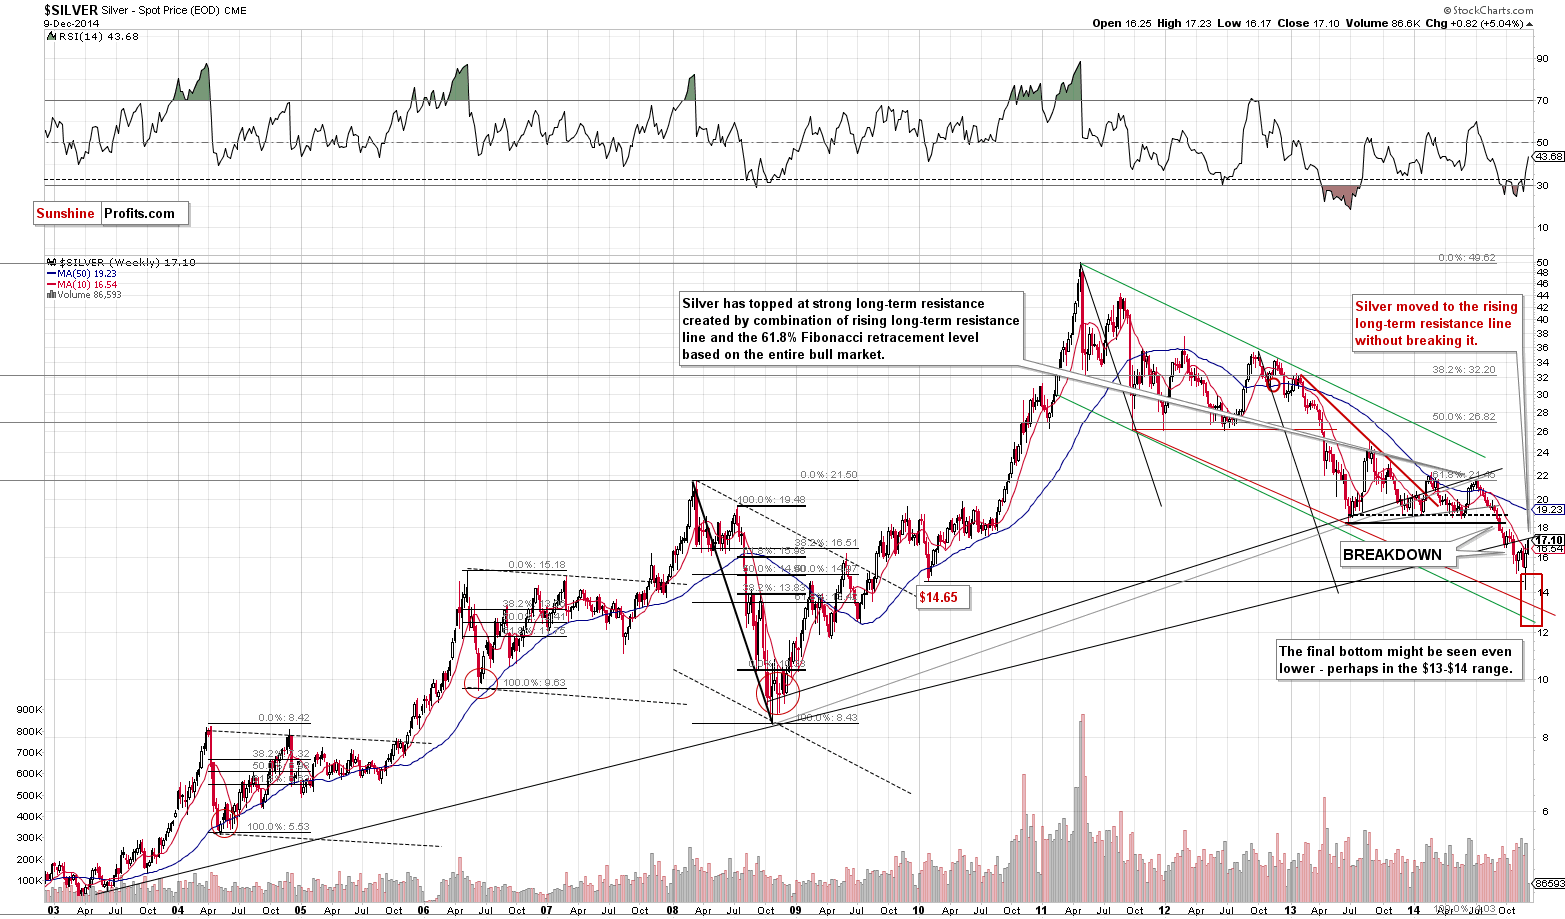
The white metal moved to its very long-term rising resistance line, which it had broken earlier this year. From the long-term perspective, the recent rally is simply a verification of this breakdown. Moreover, please note that silver is still way below its 2013 lows at this time.
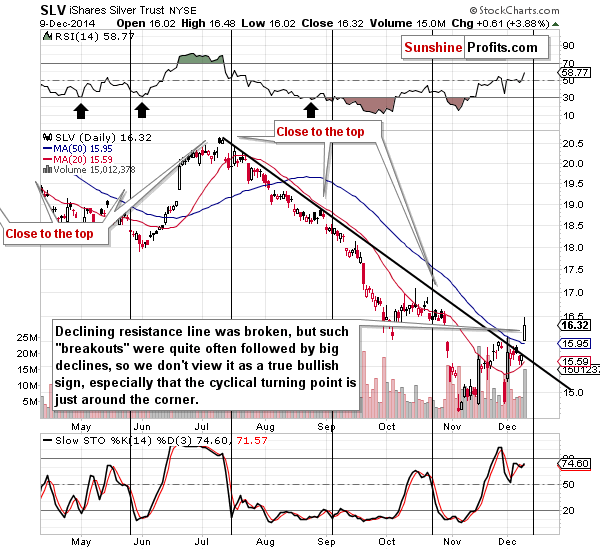
As far as the short term is concerned, comments from yesterday’s second alert remain up-to-date:
Silver moved above its declining short-term resistance line just before its cyclical turning point. This is actually a bearish combination. Silver is known to flash fake buy signals (often in forms of various breakouts) just before taking another dive. This could be the case also this time.
In other words, viewing silver’s breakout as bullish might be premature at this point.
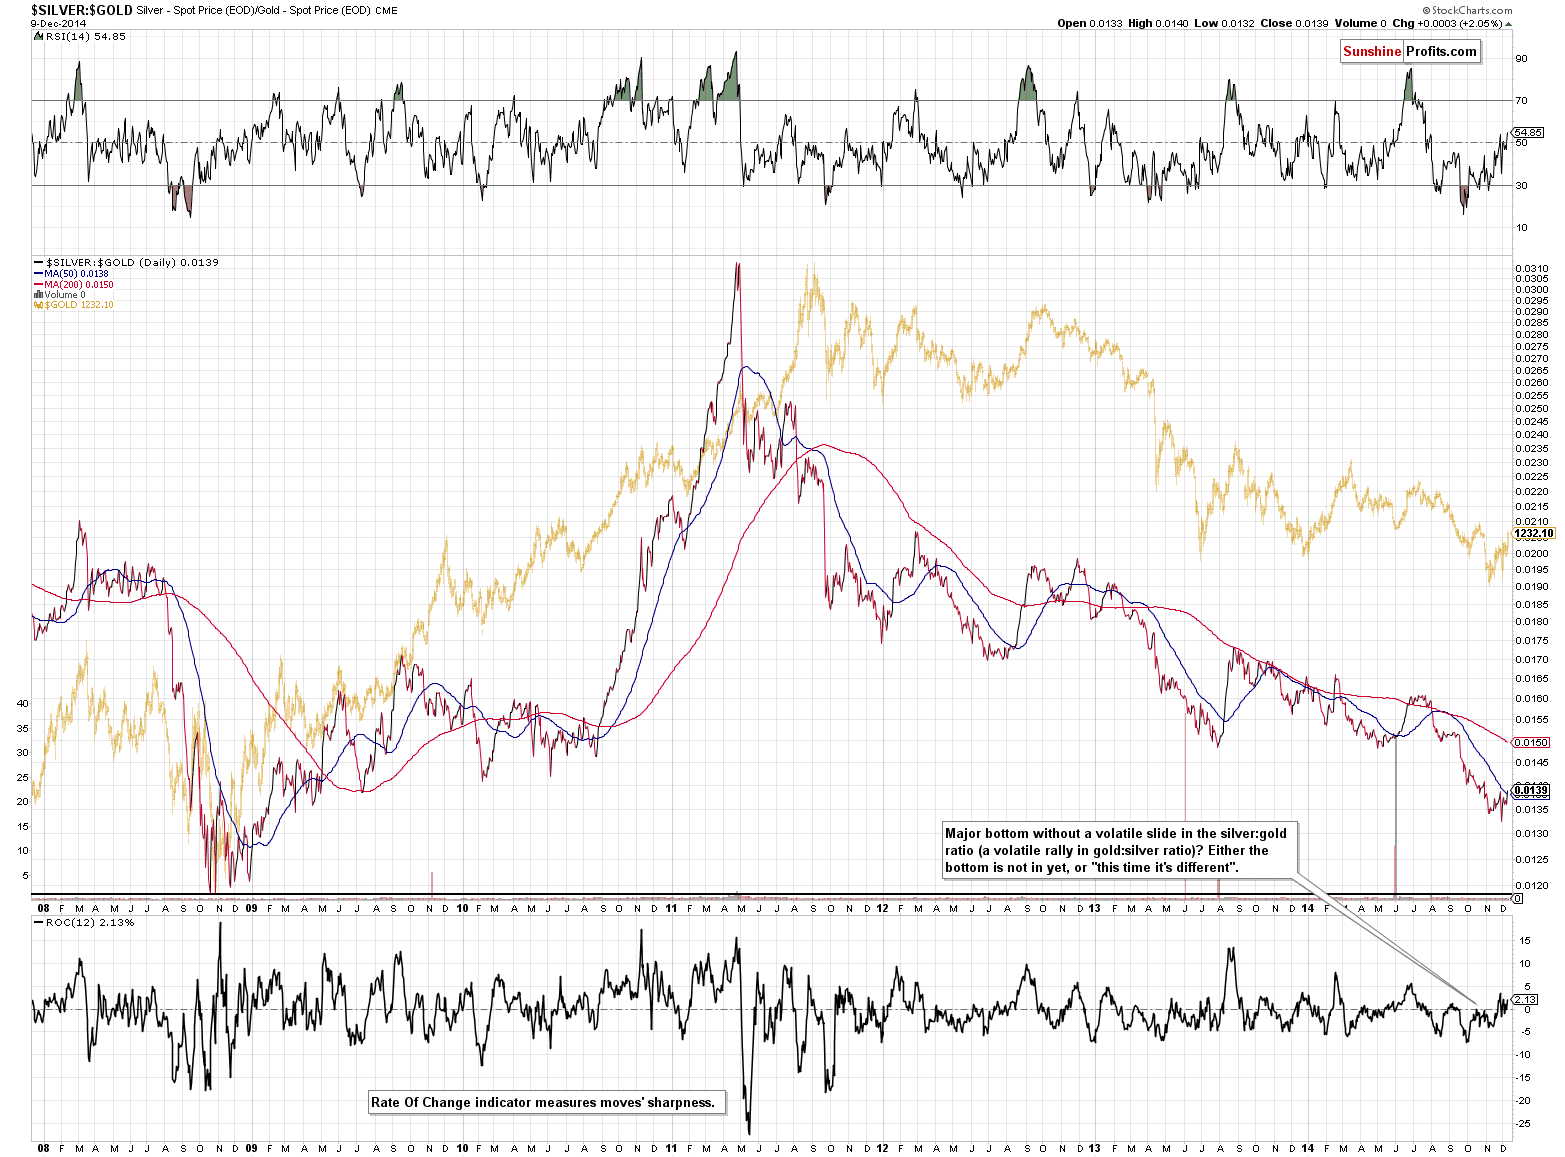
The silver to gold ratio is something that should be reminded at this time in light of the thoughts that perhaps the final bottom in the precious metals market was already formed. If so, this would be one of the very few (or the first, depending on how one defines “major”) major declines that didn’t end with silver’s sharp underperformance. The panic sell-off in silver is what we have usually seen in the final days of big declines. It seems to us very unlikely that such a major decline as the 2011 – 2014 (?) one would end without this important sing. Conversely, we expect the “panic” to be particularly visible and accompanied by headlines in the main financial media. Consequently, it seems that silver and the rest of the precious metals market could move even lower before the decline is completely over.
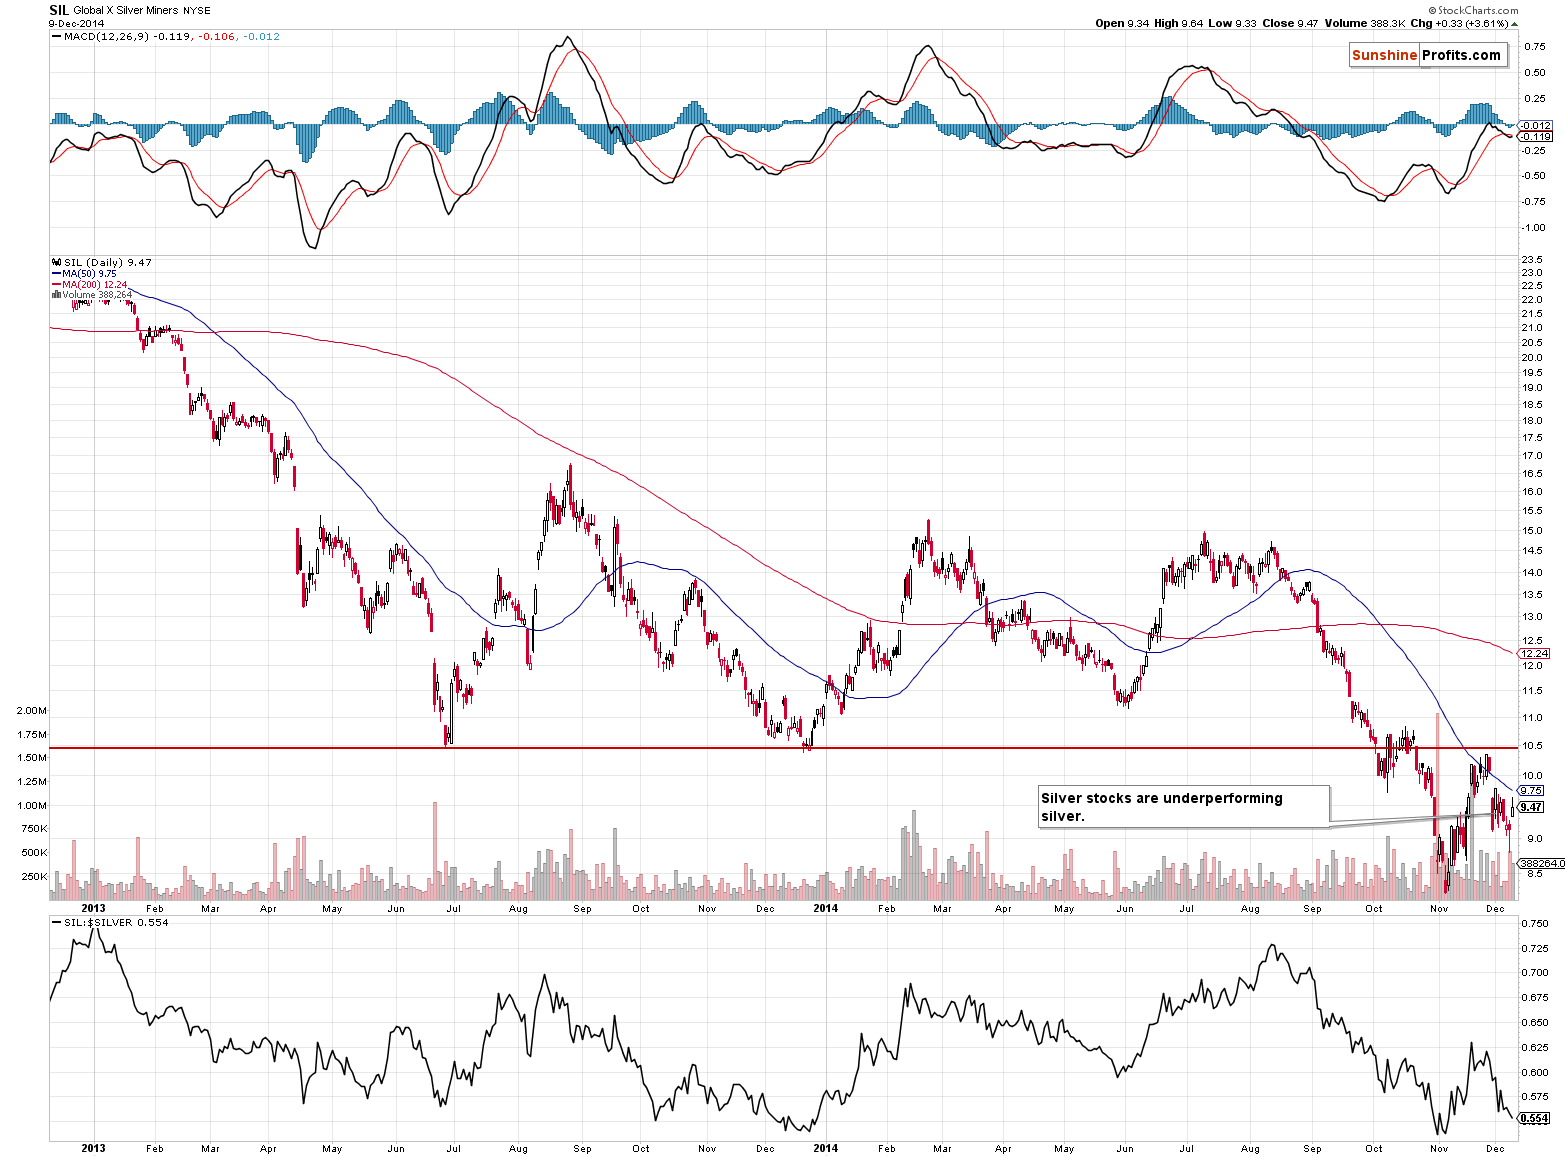
Silver stocks have been surprisingly weak in the past weeks. After the show of strength in the first half of November, silver miners declined despite the recent move higher in the white metal and the general stock market. This is a bearish indication and a confirmation of the bearish signal from gold stocks.
Speaking of gold stocks...
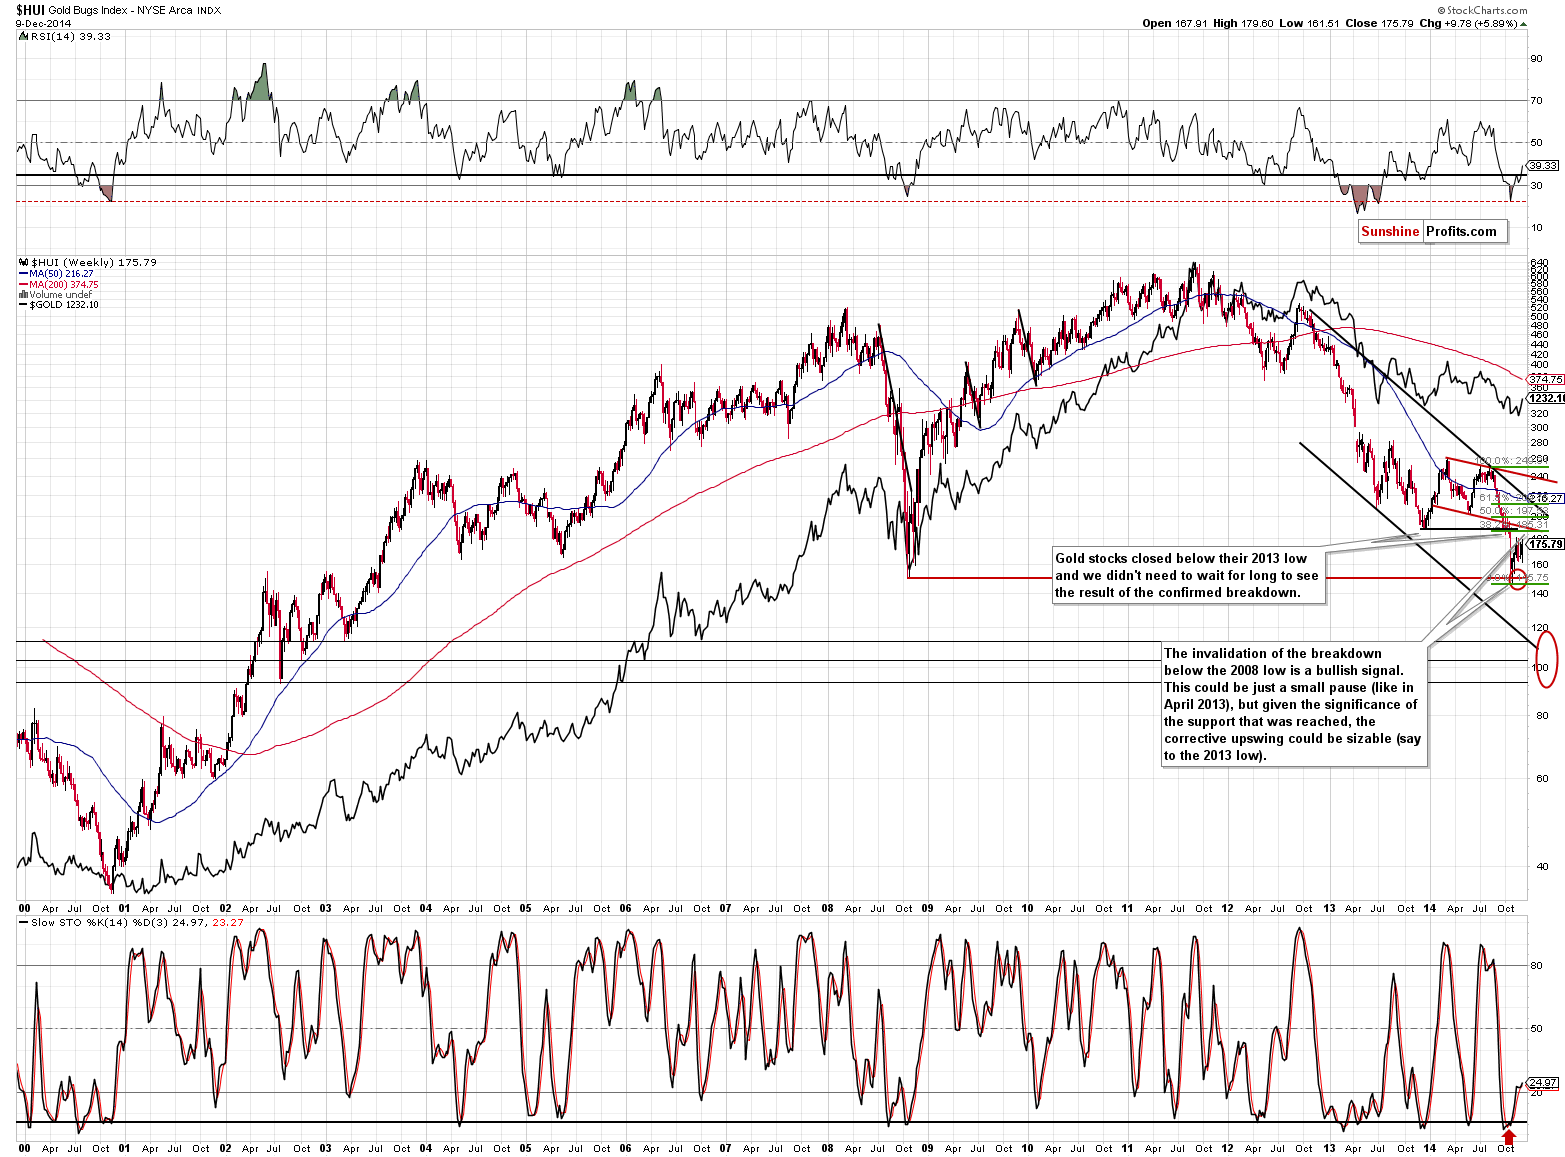
They moved higher yesterday, but remain well below their 2013 low, which means that the breakdown below it was not invalidated and that the most recent move higher is simply a correction.
The most important thing about gold stocks at this time is the fact that they stopped outperforming gold and are now underperforming it.
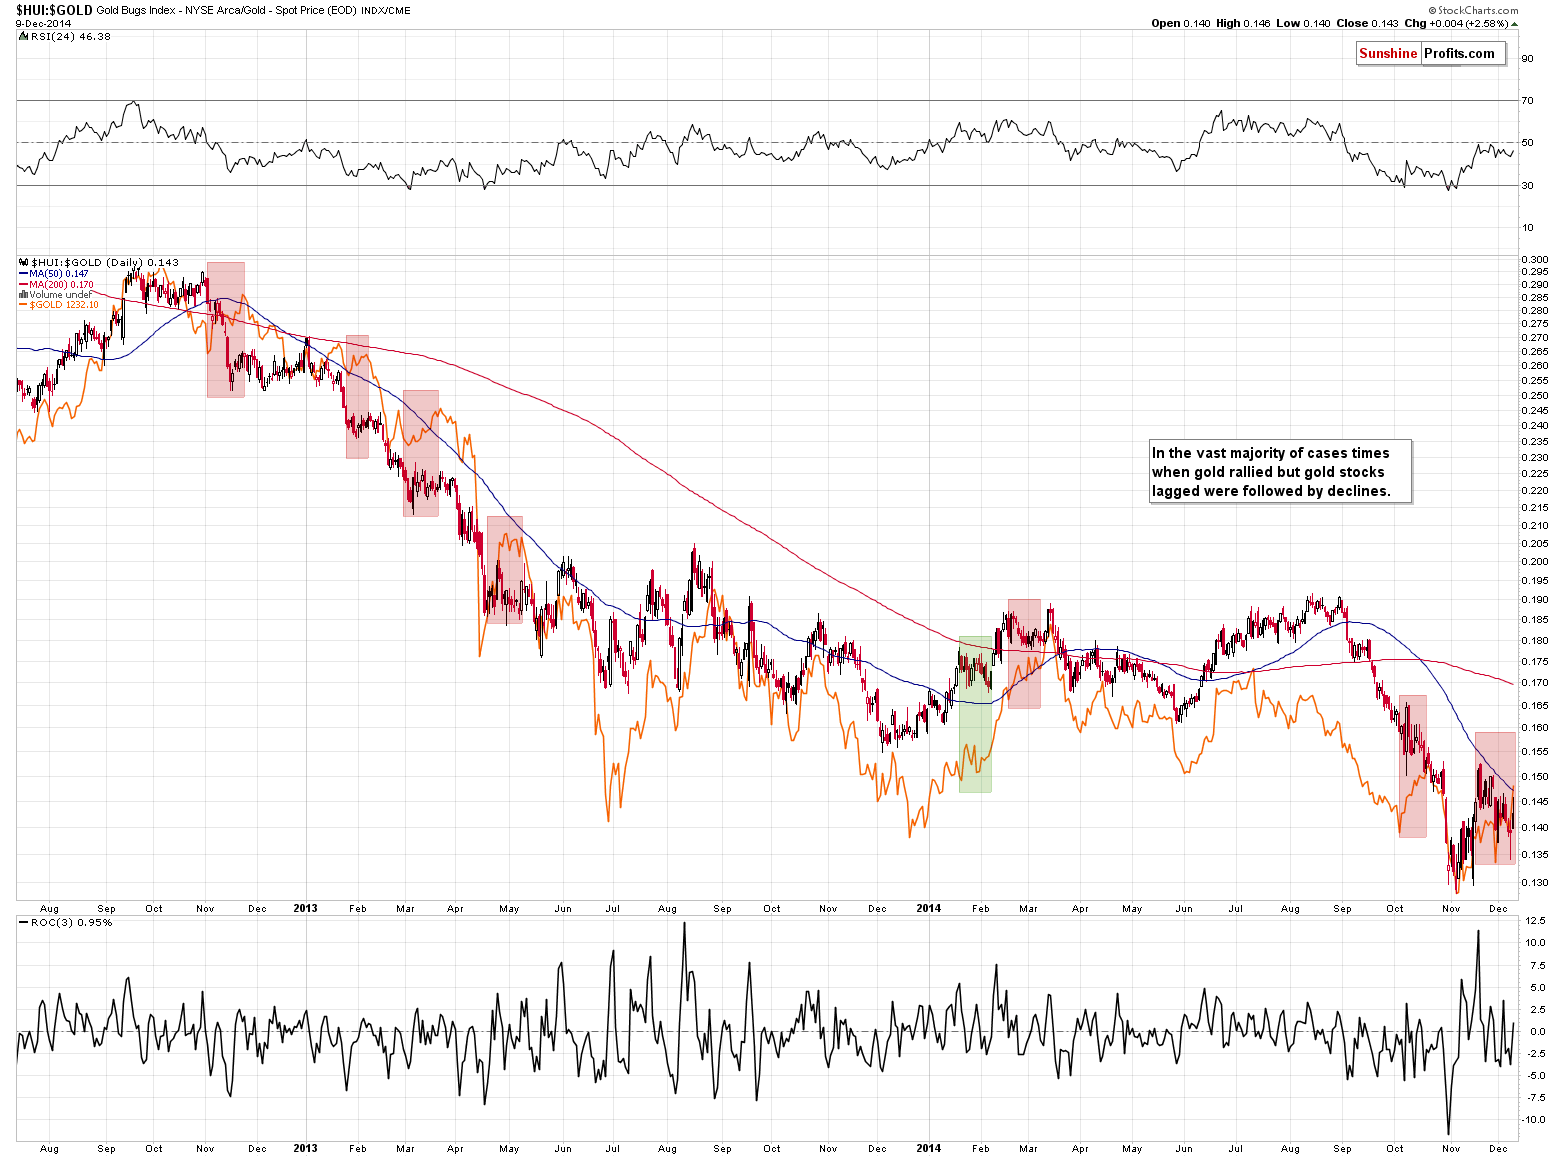
The above chart features the HUI to gold ratio. We marked the areas when gold rallied but the ratio declined at the same time (which is what we have been seeing for the last 3 weeks or so). It turns out that in almost all cases (and the only exception was seen when the decline in the ratio was very small, which is not the case right now) this was what preceded local tops and subsequent declines.
When commenting on gold, we wrote that it was important to note that the previous decline had ended at the end of 2013. Please note what the gold stocks to gold ratio did back then. It moved higher while gold continued to decline. It was a bullish sing and the opposite of what we are seeing at this time. Consequently, we might not have seen the final bottom just yet.
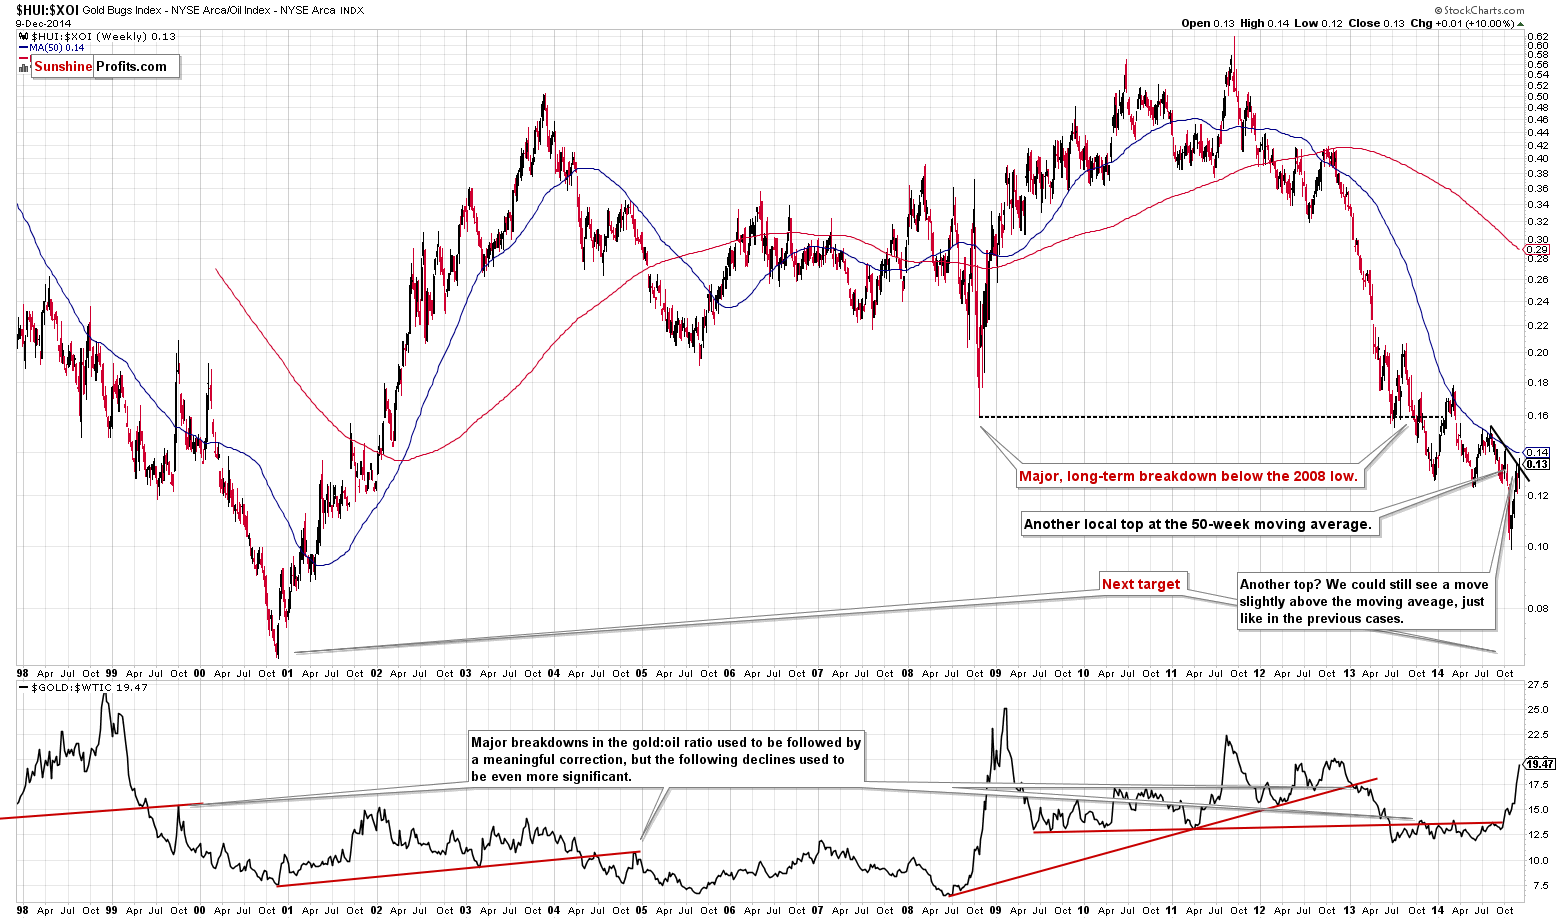
Meanwhile, the gold stocks to oil stocks ratio continues to suggest that we might see a little more short-term strength before the decline continues. At the same time we see that the rally is yet another correction.
In the previous cases the ratio topped at or slightly above the 50-week moving average. That’s something we haven’t seen so far.
Finally, we would like to present a chart with a major change.
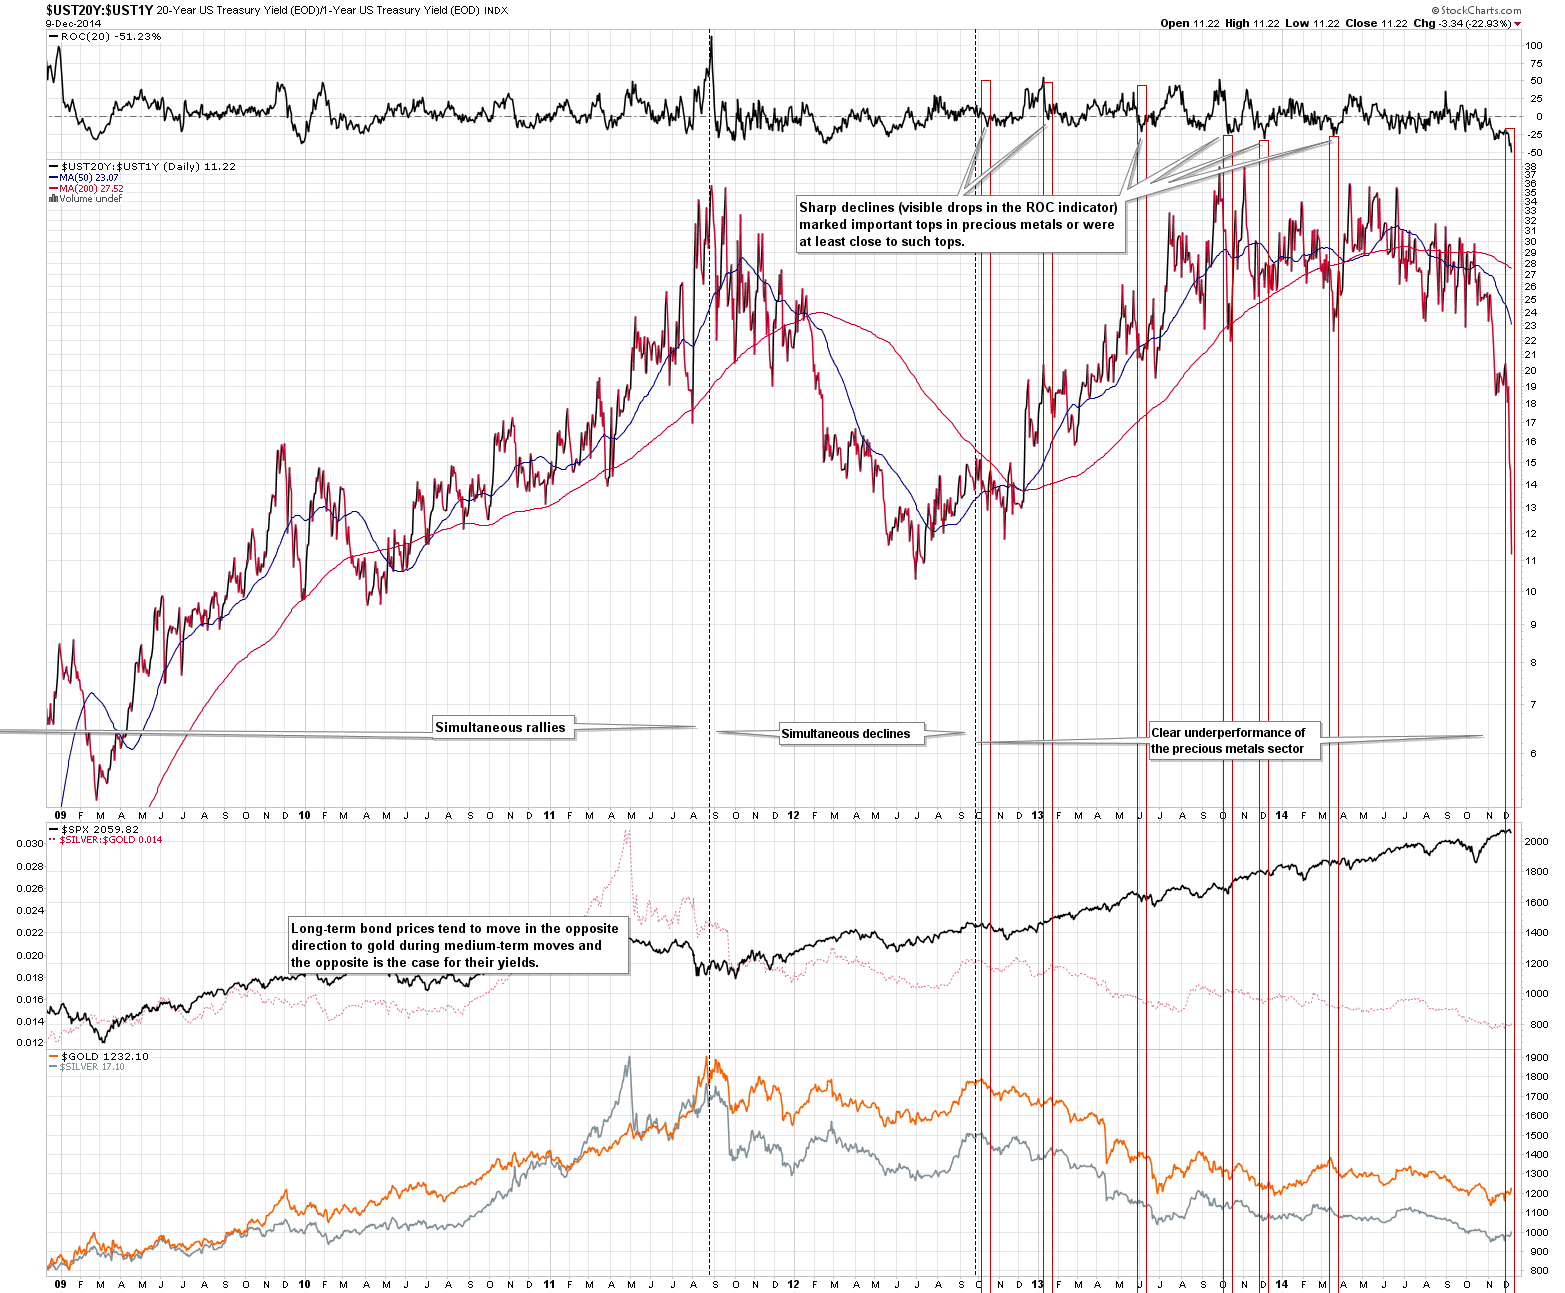
Sharp declines in the yields of 20-year bonds relative to the yields of 1-year bonds are something that marked or preceded important tops in the precious metals market. The slide in the value of the ratio that we have just seen was enormous, which is a significant bearish signal for the precious metals market.
Please note that we didn’t see such a signal at the end of 2013.
Summing up, there are many factors that are currently in play that have contradictory implications, which makes the short-term outlook rather unclear, even though the medium-term one remains bearish.
We have not seen silver’s huge underperformance and gold is not hated in the financial media (at least not very significantly) and long-term charts are showing declining trends. We could see some short-term strength in gold based on various factors, but at this time it’s too early to say that the next big upswing is underway. Most sings point out that the current rally in gold is simply a correction within a downtrend.
The thing that could generate a bigger upswing in gold is a big decline in the USD Index, and the latter could actually happen based on the resistance level being reached and that might happen relatively soon. However, the USD could move even higher – to the rising green support line – and we could also see gold’s move lower take place regardless of the situation in the USD. Perhaps gold is rallying not because of its inner strength (weak performance of mining stocks suggests that the sector is not really strong), but because it got too low too fast and simply had to correct.
It our view, the best approach is to continue to monitor the situation and take action once it clarifies. Gold’s ability to decline regardless of what’s going on in the USD Index would be a perfect bearish confirmation, but we have not seen it so far. If USD Index moves above the 90 level and holds it, then we would likely see an even greater rally and another big downswing in gold, anyway.
We’ll keep you – our subscribers - informed.
To summarize:
Trading capital (our opinion): No positions
Long-term capital (our opinion): No positions
Insurance capital (our opinion): Full position
Please note that a full position doesn’t mean using all of the capital for a given trade. You will find details on our thoughts on gold portfolio structuring in the Key Insights section on our website.
As a reminder – “initial target price” means exactly that – an “initial” one, it’s not a price level at which we suggest closing positions. If this becomes the case (like it did in the previous trade) we will refer to these levels as levels of exit orders (exactly as we’ve done previously). Stop-loss levels, however, are naturally not “initial”, but something that, in our opinion, might be entered as an order.
Since it is impossible to synchronize target prices and stop-loss levels for all the ETFs and ETNs with the main markets that we provide these levels for (gold, silver and mining stocks – the GDX ETF), the stop-loss levels and target prices for other ETNs and ETF (among other: UGLD, DGLD, USLV, DSLV, NUGT, DUST, JNUG, JDST) are provided as supplementary, and not as “final”. This means that if a stop-loss or a target level is reached for any of the “additional instruments” (DGLD for instance), but not for the “main instrument” (gold in this case), we will view positions in both gold and DGLD as still open and the stop-loss for DGLD would have to be moved lower. On the other hand, if gold moves to a stop-loss level but DGLD doesn’t, then we will view both positions (in gold and DGLD) as closed. In other words, since it’s not possible to be 100% certain that each related instrument moves to a given level when the underlying instrument does, we can’t provide levels that would be binding. The levels that we do provide are our best estimate of the levels that will correspond to the levels in the underlying assets, but it will be the underlying assets that one will need to focus on regarding the sings pointing to closing a given position or keeping it open. We might adjust the levels in the “additional instruments” without adjusting the levels in the “main instruments”, which will simply mean that we have improved our estimation of these levels, not that we changed our outlook on the markets. We are already working on a tool that would update these levels on a daily basis for the most popular ETFs, ETNs and individual mining stocks.
Our preferred ways to invest in and to trade gold along with the reasoning can be found in the how to buy gold section. Additionally, our preferred ETFs and ETNs can be found in our Gold & Silver ETF Ranking.
As always, we'll keep you - our subscribers - updated should our views on the market change. We will continue to send out Gold & Silver Trading Alerts on each trading day and we will send additional Alerts whenever appropriate.
The trading position presented above is the netted version of positions based on subjective signals (opinion) from your Editor, and the automated tools (SP Indicators and the upcoming self-similarity-based tool).
As a reminder, Gold & Silver Trading Alerts are posted before or on each trading day (we usually post them before the opening bell, but we don't promise doing that each day). If there's anything urgent, we will send you an additional small alert before posting the main one.
Would you like to stay updated on our free alerts (like the one that you've just read)? Sign up for our free mailing list today - it will take just a few seconds and you can unsubscribe just as easily.
Thank you.
Sincerely,
Przemyslaw Radomski, CFA
Founder, Editor-in-chief
Gold & Silver Trading Alerts
Forex Trading Alerts
Oil Investment Updates
Oil Trading Alerts
