
Gold & Silver Trading Alert originally sent to subscribers on June 11, 2014, 6:56 AM.
Briefly: In our opinion no speculative positions in gold, silver and mining stocks are justified from the risk/reward perspective.
The precious metals market moved higher yesterday, which was in tune with what we've been expecting. The key question is if gold, silver and mining stocks have completed their rally or are they still likely to move higher before turning south again.
Before jumping into charts, we would like to point out that the reasons for which we think the medium-term move is down were covered in the previous Monday’s alert, and if you haven’t had the chance to read it, we encourage you to do so today. Having said that, let’s move to charts (charts courtesy of http://stockcharts.com.)
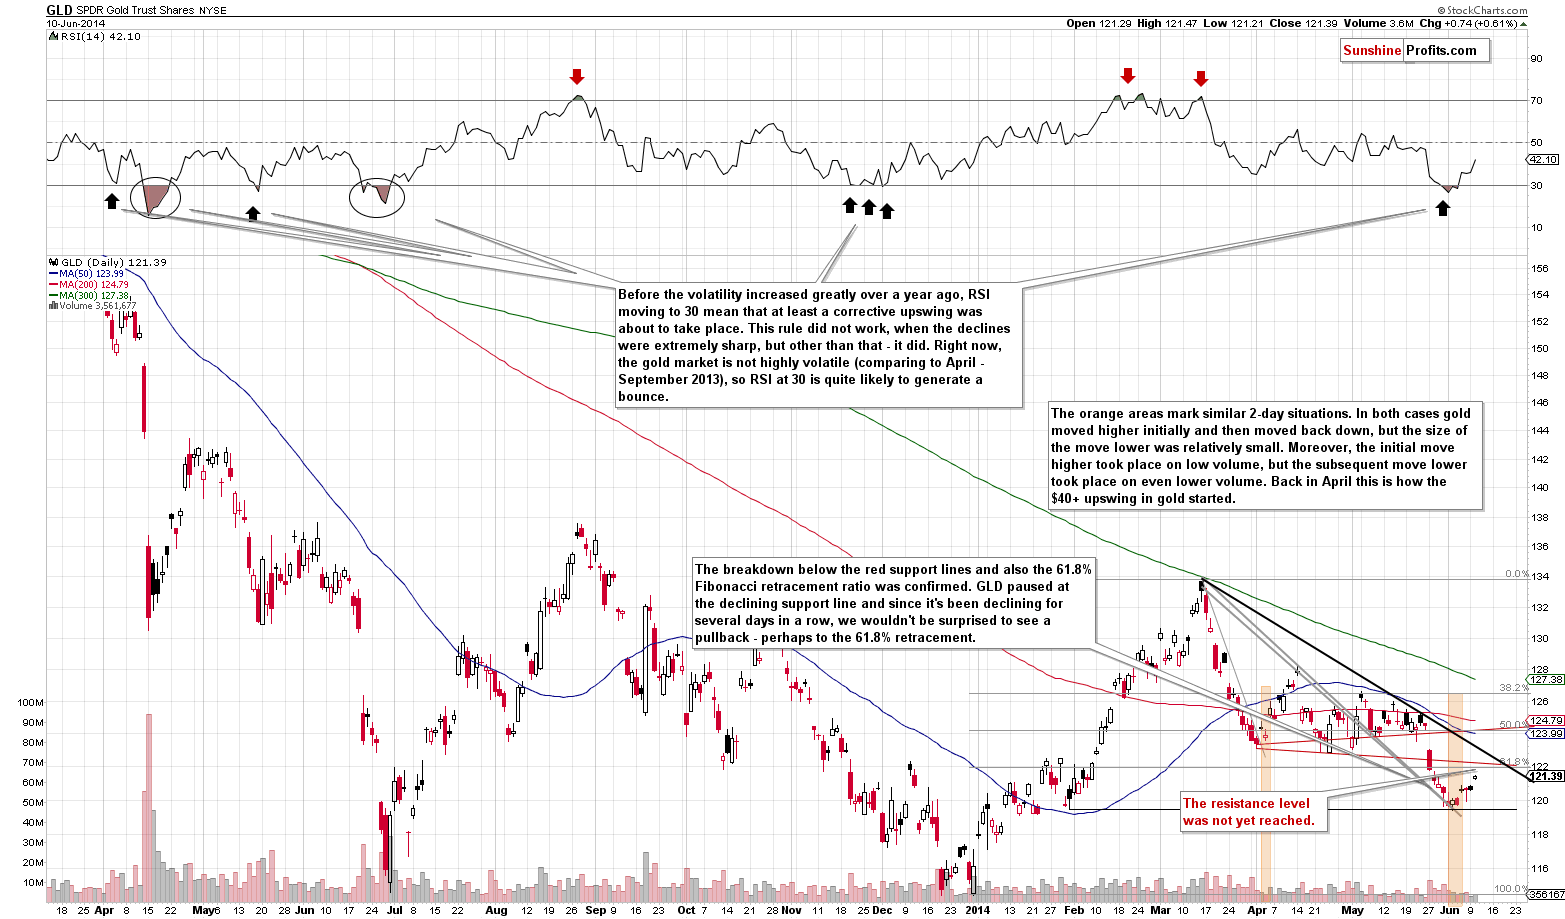
Gold moved higher, but hasn't reached the levels that we thought were likely to stop the rally.
Quoting our previous alert:
How high will gold rally before turning south again? There are no sure bets, but our best guess is that it will correct to the previously broken 61.8% or 50% Fibonacci retracement levels – which means a move to (or very close to) $122 or $124.50 or so in case of the GLD ETF and $1,260 or $1,290 in case of spot gold. We will be looking for bearish confirmations (signals from indicators, ratios, other markets, etc.) around these levels and we’ll probably re-enter short positions once we see them.
We saw the GLD ETF close at $121.39, so it's still below the lowest of the above-mentioned resistance levels and thus it seems that the rally will continue for at least a while.
What's even more interesting, is the fact that gold managed to rally despite a rally in the USD Index.
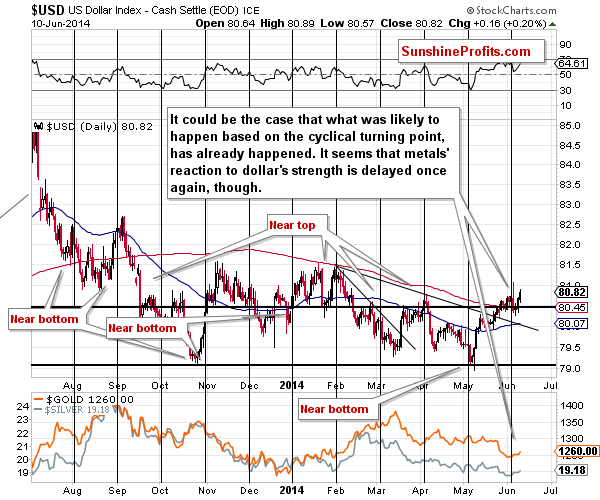
At this point it's worth quoting what we wrote in the previous alert:
When a given market refuses to react in a certain way in spite of a visible factor for such a move, it usually means that a move in the opposite direction is likely. At this time, precious metals refused to decline given the move higher in the USD Index, which means that they “don’t want to” move lower and that they are not done rallying.
During yesterday’s session gold has not only not-declined – it actually managed to rally despite USD gains and the short-term implications for the precious metals market are bullish in the short term. There are none in the medium term as metals' reaction to dollar's strength can – and likely is – delayed once again.
The situation on the silver market remains rather unclear so we will once again seek confirmations in the mining stock sector.
The situation in mining stocks is even more bullish for the short term than it is the case with gold. Before commenting on yesterday’s price/volume action we would like to quote our previous comments as they remain up-to-date:
Mining stocks declined on Monday, but moved lower on low volume, which suggests that this might not have been the true direction of the move. The move lower was relatively small – compared to the size of the upswing in the USD Index, so the overall implications are overall bullish. (...)
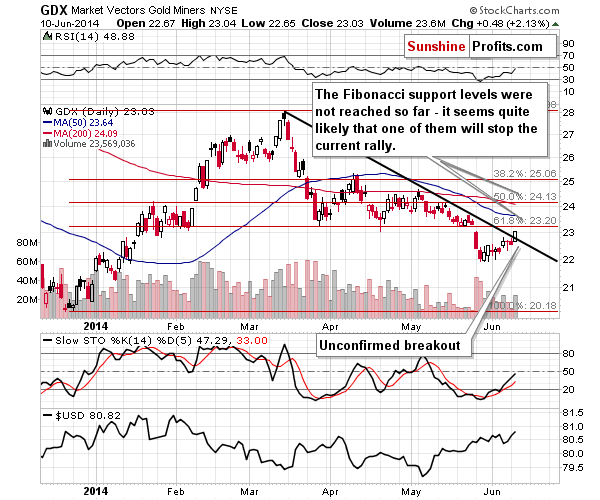
In case of the GDX ETF, the price targets are relatively close as well. The first one is slightly below the $23 level, at the declining resistance line, and the second one is at the 61.8% Fibonacci retracement. The third one is at the 50% Fibonacci retracement slightly above the $24 level. Either way, the upside is rather limited and we don’t think that the GDX will move and stay above $24 for long – if it gets there, that is.
If gold is to double its recent move higher, then we could expect mining stocks to move at least to their 61.8% Fibonacci retracement, slightly above $23.
Miners moved above their initial target level – we saw a breakout above the declining resistance line. The move above it was rather insignificant, so it's not necessarily really meaningful. The volume accompanying the breakout was not small, but it was not really huge either – we don't think it was big enough to confirm the breakout on its own. Given the situation on the gold market (the resistance level was not reached), it seems that the mining stocks could see higher prices in the coming few days as well, but we don't think that this is the start of another huge rally just yet.
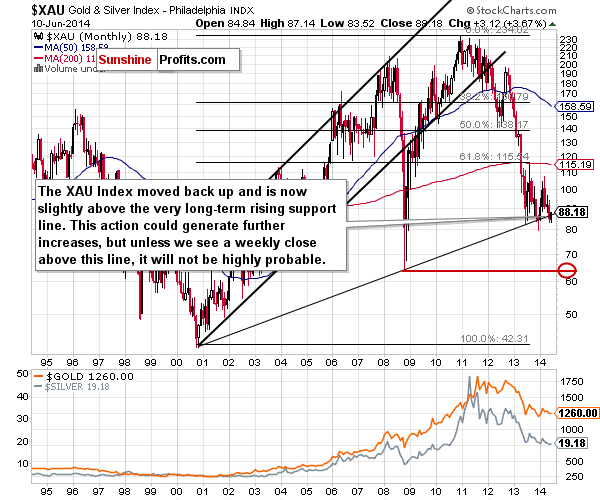
There is one more slightly bullish factor that we saw in case of the XAU Index (which includes both: gold stocks and silver stocks). We are commenting on it because we have previously written that the breakdown in the XAU Index – if confirmed – will be a very bearish factor for the entire precious metals sector. The point is that it was – to some extent – invalidated.
At this point you might be wondering how a breakdown can be “partially” invalidated (just as someone can't be partly on a plane – you either are on it or not; ...OK – we realize that it is possible in the quantum sense, but that's not what we mean here).
The key thing to keep in mind here is the very long-term nature of the above chart and the support line that we are discussing. Such lines often need something more than just an intra-day move or even a daily close to constitute a meaningful move – be that a breakout or breakdown. In some cases a weekly close is enough and in some cases one would ideally want to see a monthly close before viewing a given move as real. At this time its rather unclear exactly how long should we wait for a confirmation or what invalidates a breakdown, however it's quite probable that an intra-week move is not enough to change much. Consequently, we don't view the above-mentioned “invalidation” as meaningful just yet. In other words, the implications are only slightly bullish.
As it is the case with gold, we will be monitoring the markets for signs of weakness and bearish confirmations to estimate at which of these levels it’s best to re-enter short positions. The situation is much less clear in terms of price targets when it comes to silver, so we will focus on other markets to estimate the time when shorting the silver market seems justified from the risk/reward perspective once again.
Summing up, while the medium-term trend in the precious metals market is down, we are seeing a corrective upswing and it doesn’t seem that it’s over yet. It seems quite likely that the rally will be over relatively soon, perhaps when the USD Index reaches the 80 level (however, this level might not be reached based on this week's rally in the USD, so we will look for other signs that the rally in the metals is over as well).
To summarize:
Trading capital (our opinion): No positions
Long-term capital: No positions
Insurance capital: Full position
Please note that a full position doesn’t mean using all of the capital for a given trade. You will find details on our thoughts on gold portfolio structuring in the Key Insights section on our website.
As always, we'll keep you - our subscribers - updated should our views on the market change. We will continue to send out Gold & Silver Trading Alerts on each trading day and we will send additional Alerts whenever appropriate.
The trading position presented above is the netted version of positions based on subjective signals (opinion) from your Editor, and the automated tools (SP Indicators and the upcoming self-similarity-based tool).
As a reminder, Gold & Silver Trading Alerts are posted before or on each trading day (we usually post them before the opening bell, but we don't promise doing that each day). If there's anything urgent, we will send you an additional small alert before posting the main one.
Thank you.
Sincerely,
Przemyslaw Radomski, CFA
Founder, Editor-in-chief
Gold & Silver Trading Alerts
Forex Trading Alerts
Oil Investment Updates
Oil Trading Alerts
