
Based on the July 15th, 2011 Premium Update. Visit our archives for more gold & silver articles.
Gold surged to a new record on Wednesday, propelled by the possibility of a third round of quantitative easing in the US. Already rallying hard on the back of fiscal concerns in the Eurozone, gold jumped to within reach of $1,600 an ounce after Fed Chairman Ben Bernanke said the central bank could take further steps to prop up the US economy if needed (read that as QE3). Gold rose as much as 1.4 per cent on Wednesday to touch a new peak of $1,587.46 an ounce. That surpassed the previous peak of $1,575, reached on May 2. Looking back we see that gold rallied about $270 an ounce between Bernankes first mention in August of last year of a second round of quantitative easing or QE2 and the end of the program in June.
Every time gold takes off we are asked if it is too late to enter the gold trade. Gold has gone from $300 to well over $1,587 in a decade. That is a 400% gain compared with effectively no gain for the Standard & Poors 500 Index (SNC:SPX). Some investors feel that gold is already too high and anyway, how much higher can it go.
Our answer is short and sweet for the long termhighermuch higher.
For those who still have their doubts, here are just 3 reasons why we believe gold and silver will vault forward in the long run. Anyone not in a coma can see that from an economic point of view we are living in historic times. Black swans are circling as we grapple with fallout from the all-too-recent meltdown, the ominous and even frightening possibility of sovereign-debt defaults, and political uncertainty across the globe. It is in times such as these that people look for a safe haven, and the one that makes most sense is gold.
So, here is our very short list, in no particular order.
1. If investors are not already nervous enough, the recent U.S. deficit-reduction debate has surely raised concern about a U.S. default; destruction of the U.S. dollar; and even the possibility of a global recession or depression. Moodys placed the US triple A rating on review for a possible downgrade as fears mounted that Washington will fail to raise the federal debt ceiling by August 2. The Moodys warning came as Ben Bernanke issued his most explicit warning yet on what would happen if the debt ceiling is not raised, a recession on the scale of 2008 would be certainly conceivable and that it would have a very adverse effect very quickly on the recovery. If there is no increase by August 2, the US could only spend incoming revenues, leading to default on some obligations.
2. Inflation is rearing its ugly head in China and in food prices around the world. That gives support the price of gold as paper assets lose purchasing power. Gold is a hedge against inflation under the current financial system.
3. As we have been reporting, central banks, particularly Russias and Mexicos, have become large buyers of gold and will likely purchase more this year, increasing worldwide demand for the precious metal.
With everything that has happened with precious metals this week, lets not delay any longer and lets take a look at the current situation in the mining stocks. However, first lets briefly examine the latest events in the main stock indices. We will start with the long-term chart of the S&P 500 Index (charts courtesy by http://stockcharts.com).
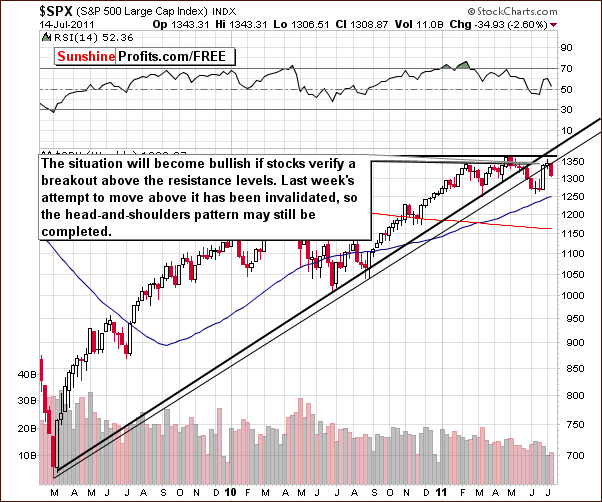
In the medium-term S&P 500 Index chart this week, we see that stocks have reversed after a failed attempt to move back above the rising resistance line. This was followed by a decline last week and another this week as well. In last weeks Premium Updatewe wrote that if stocks decline from here, the possibility of a bearish head-and-shoulders pattern developing will be quite likely. In this scenario it would be quite likely that a decline similar to what was seen in the middle of 2010 takes place.
We have previously seen a number of situations where the bearish head-and-shoulders pattern has been invalidated before forming. Nonetheless, this pattern could very well complete if stocks continued to decline. The result of a head-and-shoulders pattern completion could be much lower S&P 500 levels, possibly to or slightly below 1200.
The bearish case does not stem from the above chart alone. Its also confirmed by the financial sector.
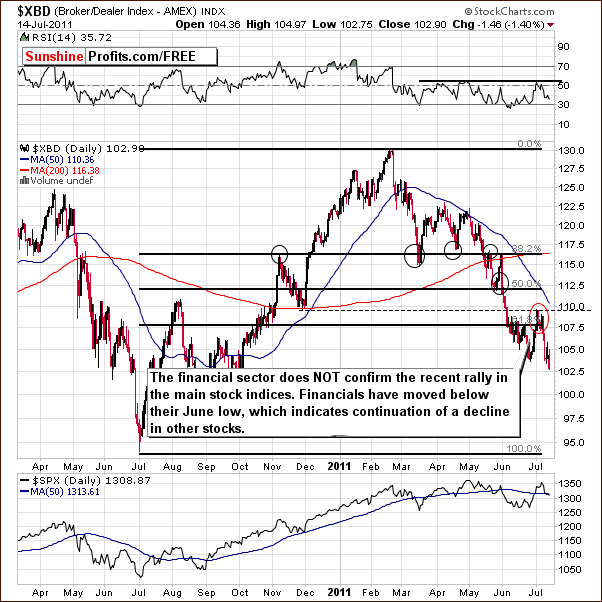
In this weeks XBD Broker-Dealer Index (proxy for the financial sector) chart, we see the index has reached new 2011 lows, moving below the lows seen last month. Since this is a leading indicator for the general stock market, the situation does not look good for stocks in the short term.
Lets see what it means for the mining stocks.
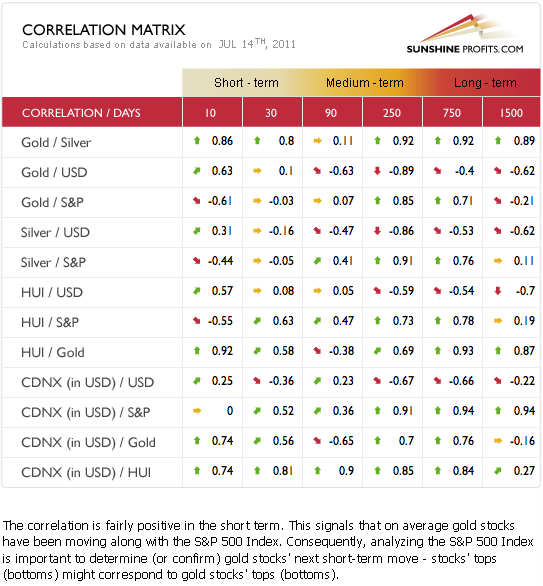
As you may see above the 0.63 correlation coefficient number between HUI and S&P 500 in the short-term (based on the last 30 trading days) column, it is unlikely that mining stocks will continue to outperform gold if stocks in general plunge.
Moreover, in the medium-term column, we see significant negative coefficients for precious metals and the dollar. Therefore if the USD Index confirms its breakout and rallies in the medium term, lower prices will likely be seen for gold and silver over this time frame.
Moving on to the mining stocks, the HUI Index does not look too bullish at this time.
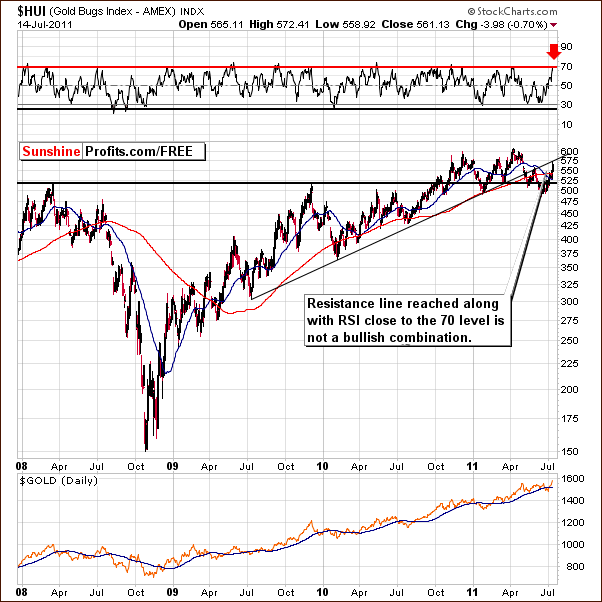
Namely, in this weeks HUI Index chart, we see a sell signal based on the RSI which has reached an overbought status. This took place while the HUI Index itself was moving to the rising resistance line. Therefore, a short-term decline in gold mining stocks appears quite likely.
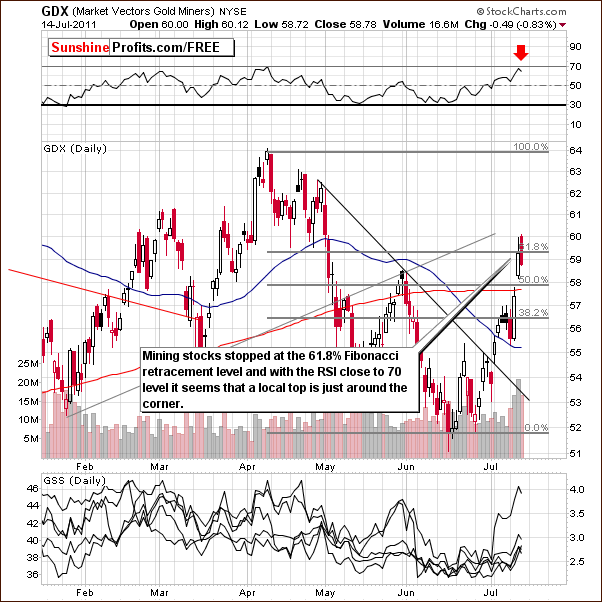
In this weeks short-term GDX ETF chart, the gold miners have corrected 61.8% of the previous decline and therefore the trend remains down unless this level is taken out. Although it is a possibility, indications are that a decline is more likely. This is consistent with the signal received in our analysis of the long-term HUI Index chart.
Another - quite reliable - sell signal comes from the analysis of the Gold Miners Bullish Percent Index.
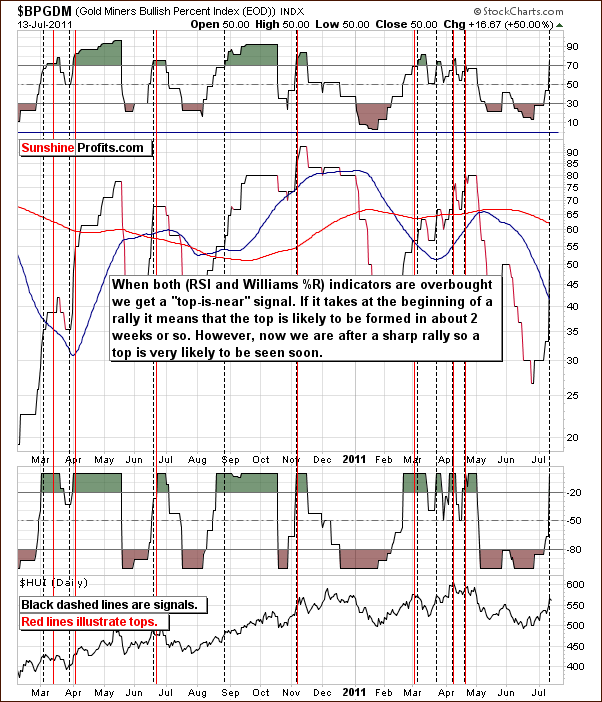
In fact, we see a situation which indicates that a top appears to be quite close. Both the RSI level and Williams %R are overbought here and this has been a reliable tool for predicting local tops in the past few years. Of course, a local top is synonymous with a sell signal for short-term Traders
Summing up, gold and silver mining stocks have rallied significantly recently but numerous indicators yield a bearish outlook for the short term.
To make sure that you are notified once the new features are implemented, and get immediate access to my free thoughts on the market, including information not available publicly, we urge you to sign up for our free e-mail list. Sign up for our gold & silver mailing list today and you'll also get free, 7-day access to the Premium Sections on my website, including valuable tools and charts dedicated to serious PM Investors and Speculators. It's free and you may unsubscribe at any time.
Thank you for reading. Have a great weekend and profitable week!
P. Radomski
--
This week we've seen a report stating that gold is on its way to 1320 - is the bull market really over despite the recent sharp rally? Today's update includes our discussion of the main points behind the above-mentioned report.
Speaking of the recent sharp rally - it took gold to new highs, but silver and mining stocks are nowhere near analogous price levels. In fact, silver moved to the same level, it moved to just after the early-May plunge. HUI Index reached a resistance level as well. What's likely to happen next? Is the decline over and other parts of the precious metals sector will follow gold higher or will the opposite be the case? Today we answer this important question and additionally include both: downside and upside targets.
We encourage you to Subscribe to the Premium Service today and read the full version of this week's analysis right away.
