
Based on the January 13th, 2012 Premium Update. Visit our archives for more gold articles.
Gold rallied this week hitting its highest in a month and breaking above its 200-day moving average. There were a myriad of reasons suggested in the financial press. Some writers said it was a stronger euro that helped boost the price above the key technical level. One headline said it was due to a buying binge from China ahead of the Lunar New Year which begins January 23. (The country imported a record 103 tons of gold from Hong Kong in November, up 19% month-on-month and a 483% increase year-on-year.) Another headline attributed the rise in the price of gold to active demand from India where consumers took advantage of a drop in local prices to stock up ahead of the wedding season beginning later this month. Whatever the reason, we gave you a heads up as long ago as on January 3rd, when we wrote in our essay on a bottom in the precious metals sector:
The fact is that breakdowns similar to the one were seeing just now have been (in all cases seen on the chart) followed by the final bottom of the consolidation (not too far below the line that is has broken), which was in turn was followed by a strong rally. In these cases, lower prices were never seen thereafter. Consequently, from both fundamental and technical perspectives, gold remains in a bull market, and what we're seeing right now may be the best buying opportunity that we'll see in the coming years.
Seasoned gold investors know that gold prices can be quite volatile - with big upswings often followed by big downswings, albeit wrapped around a rising long-term trend. At every downturn the gold bears have come out of the woodwork. And just as they have been repeatedly wrong in the past decade, they are still wrong (in our opinion) in 2012. Before this weeks rise, the Wall Street Journal wrote an obituary for gold as a safe haven. The article by Stephen L. Bernard said that it turns out gold is just another metal after all. It noted that after trading for much of 2011 as a safe haven, gold is acting more like other commodities and riskier assets these days.
For much of the past two years, when the economic slowdown and European debt crisis sent investors looking for low-risk assets, gold traded in the opposite direction of the euro. Gold could return to its safe-haven status again if the Federal Reserve embarks on another round of bond buying, which would likely hurt the dollar, analysts said. Gold is priced in dollars so it becomes cheaper to buy using other currencies when the dollar weakens. It can also serve as an alternative safe haven when U.S. currency loses its appeal.
At Sunshine Profits we are far away from writing the obituary for gold. At this point there are no indications that gold would not be up again in 2012 so the trend should remain in place.
Even if youre extremely bullish on gold in the long-term, you may want to know what the short-term outlook for gold is. Let's begin the technical part with the analysis of gold to bonds ratio (charts courtesy by http://stockcharts.com.)
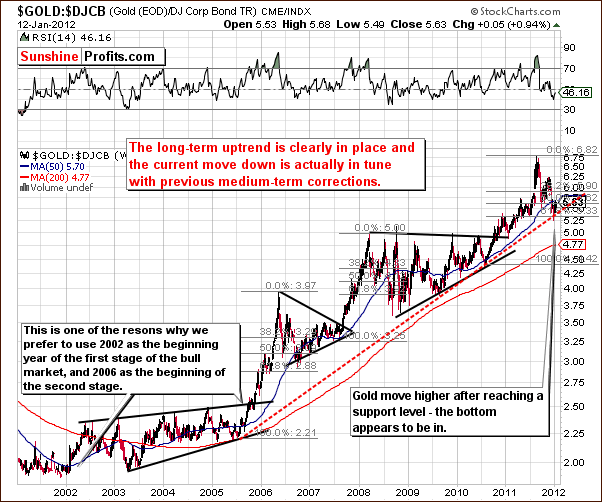
In the gold to bonds ratio chart, we also see bullish signs. The recent bottom formed close to the long-term support level and the index is now right at it after a period of zigzag correction. When comparing current patterns with the trend seen in 2006, it seems likely that a move to the upside will be seen from here.
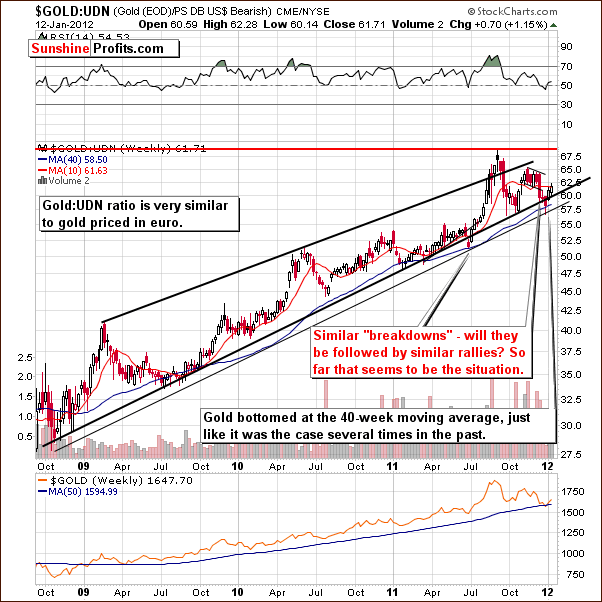
In the long-term chart of gold from a non-USD perspective, we can see that prices are clearly back within the rising trend channel. The pattern here is very similar to what was seen in the middle of 2011 and suggests that a powerful rally without a significant pause is quite possible. After such a rally, a prolonged consolidation would be probable once new highs have been reached. The implications here are different than from the comparison between today and 2006 consolidation at previous highs vs. no consolidation. However, in any of these scenarios, the weeks ahead should see higher gold prices also from a non-USD perspective.
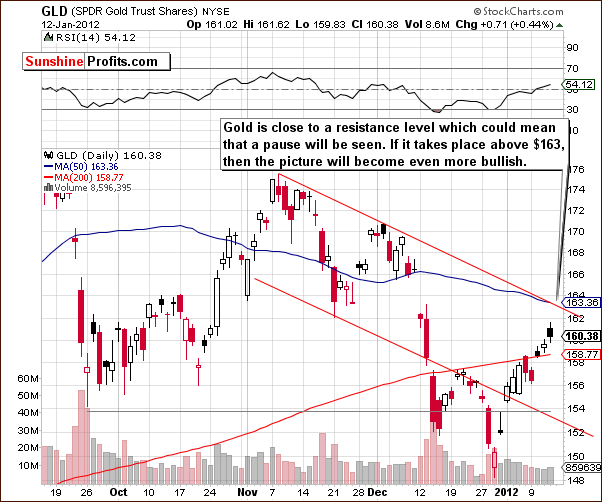
In the short-term GLD ETF chart, we see that gold is about to reach the upper border of the declining trend channel and its 50-day moving average. We could see a pause and possible consolidation around this $163 price level. The outlook will remain bullish here unless a top forms and a decline is seen on significant volume. On the other hand, if the decline takes place above the $163 level and takes gold no lower than to this particular level, it would be a very bullish development and we would likely consider adding to long positions.
Summing up, the outlook for the medium and long term for gold is bullish. The short term could very well see an insignificant pause at some point in the next 5 to 10 trading days with the rally resuming thereafter. More serious correction will likely be seen once gold moves higher, however we will leave details to our Subscribers.
To make sure that you are notified once the new features are implemented, and get immediate access to my free thoughts on the market, including information not available publicly, we urge you to sign up for our free e-mail list. Sign up for our gold & silver mailing list today and you'll also get free, 7-day access to the Premium Sections on my website, including valuable tools and charts dedicated to serious PM Investors and Speculators. It's free and you may unsubscribe at any time.
Thank you for reading. Have a great weekend and profitable week!
P. Radomski
--
This week's Premium Update starts with an overview of the various gold-related events around the world. News comes from Athens, Mumbai, London, Philippines, Germany, and Hollywood.
The main part of our analysis focuses on the recent rally and what we can expect of the precious metals market in the near term. Gold and silver markets provide different signals and their combination increases the probability of a certain outcome. What is more, gold itself appears to be following a certain pattern which allows us to estimate how much higher it can go before a significant correction takes place.
Additionally, we analyze mining stocks' performance relative to gold, elaborate on the company's valuation method that means comparing company's gold reserves to its market cap, and comment on the possibility of a deflationary scenario based on problems in Europe. We encourage you to Subscribe to the Premium Service today and read the full version of this week's analysis right away.
