
Last week I read something interesting on the Reuters website: “Gold traders in India, the world's biggest buyer of the metal, refrained from fresh purchases as prices climbed to their highest level in more than two weeks.”
I must admit that is quite surprising news, especially when we consider the investor’s behavior in June. We wrote about it in one of our essays on gold, stocks and the dollar:
“The recent collapse in gold price hasn't discouraged consumers across Asia, and in particular from China and India from buying yellow metal.”
Although gold soared to a two-and-a-half week high on Thursday, it seems that the strong decline in the gold market at the end of June decreased optimism among Indian consumers. Have these circumstances had any impact on the gold chart? Are the nearest support levels and resistance zones still valid? Let's take a closer look at the charts and find out what’s the current outlook for gold priced in rupees.
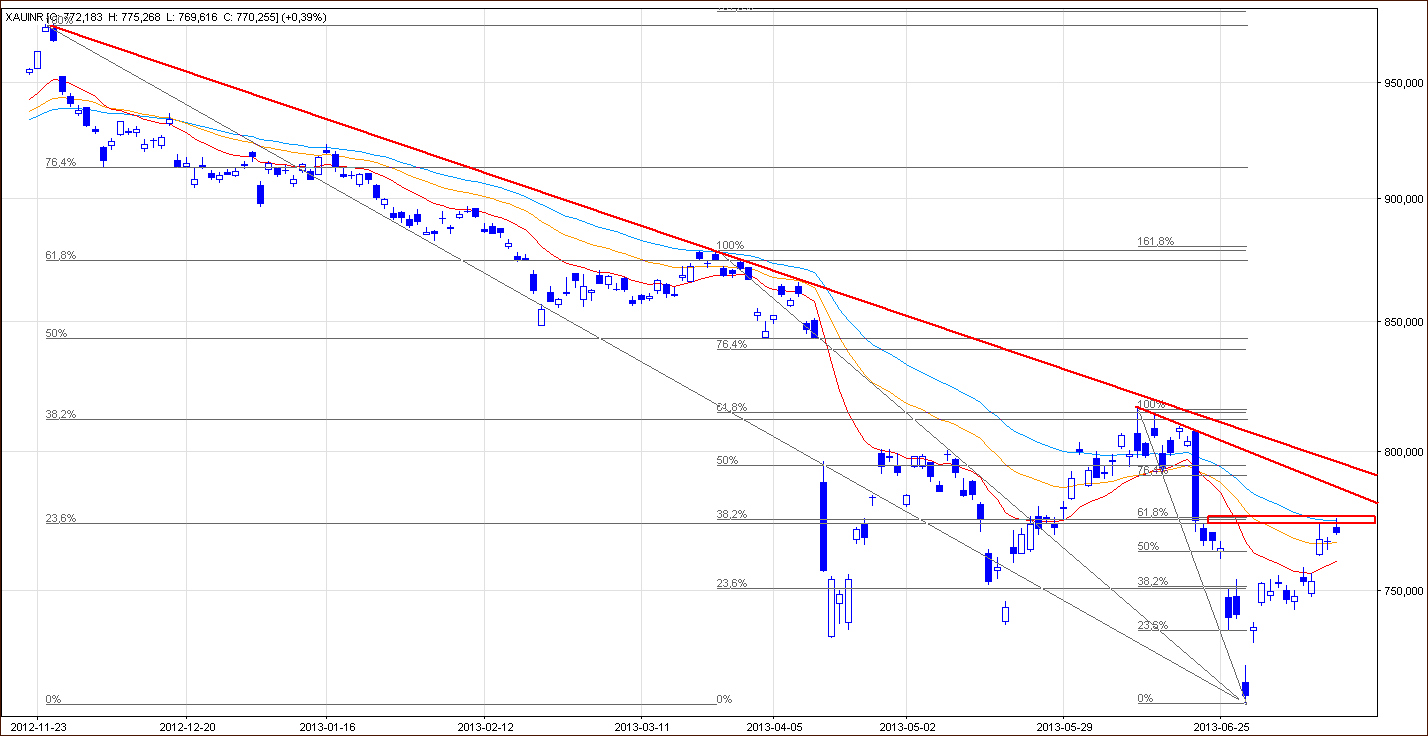
The short-term situation for gold hasn't changed much. Although the price of the yellow metal climbed up beyond the Thursday top today, it is still below its first resistance zone (based on two Fibonacci retracements - the 23.6% and 61.8% levels). I decided to apply one more Fibonacci price retracement: the march 2013 high to the 2013 low. As you see in the chart, there is the 38.2% Fibonacci retracement level which makes the previously mentioned resistance zone even stronger.
The 45-day moving average, which was broken on June 20 once again, still serves as resistance.
As I wrote in my previous essay on gold priced in rupees:
“If buyers manage to break above this strong resistance zone, we might see a bullish scenario: a further rally to the next resistance zone based on the 76.4% Fibonacci retracement and the June 14 bottom. At this point, it's worth to mention the declining resistance line based on the June highs, which might be a bearish factor that can slow further growth.”
However, if the buyers are not able to get through this resistance zone, we should prepare for a decline. In this case the first target for the bears is the green rising support line. The next support level is around the Wednesday bottom.
Once we know the Fibonacci point of view, let’s consider the price pattern of gold from the perspective of the Elliott wave principle.
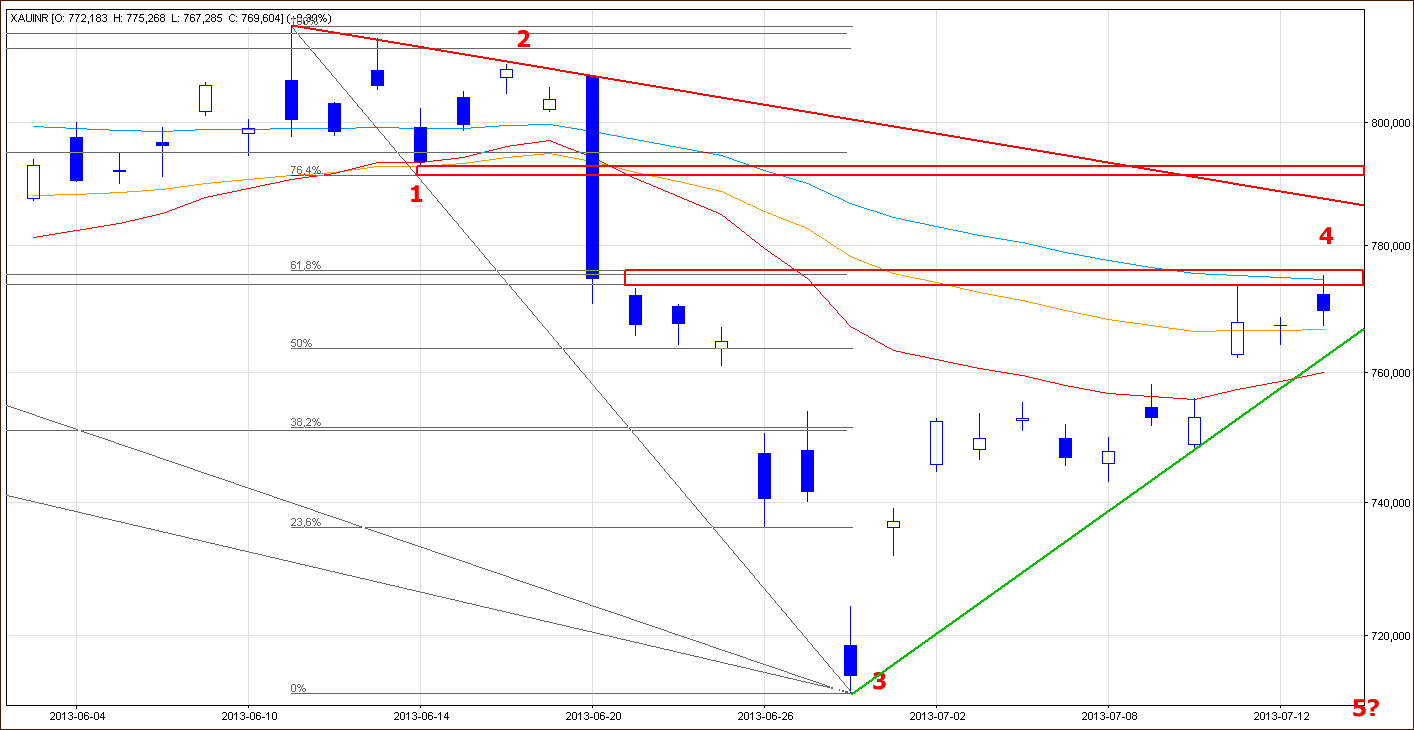
On the above chart, the situation hasn't changed either. From this point of view, a five-wave structure may not have been completed yet and there is a good possibility that the yellow metal will decline once again.
What is the investment scenario? Let's summarize.
Although gold has continued its move to the upside, it has not invalidated the most important resistance zone. From my point of view, the outlook and trend remain bearish for the short term. In the immediate future, we still could see some strength, but both the Fibonacci perspective and the perspective of the Elliott wave principle suggest the next big move will likely be to the downside.
Thank you.
Nadia Simmons
Back