
This essay is based on the Premium Update posted October 9th, 2009. Visit our archives for more gold & silver articles.
I just love it when I run across an article like the one I just read in the Wall Street Journal this week.
The headline said: "Gold is Still a Lousy Investment."
I read it differently as: "Gold Still Has a Long Way to Go."
You know you've reached the top in a bull market when the shoeshine boys and taxi drivers who heard a hot tip are clamoring to get in. Two years ago when people in cocktail parties in Florida were talking about how you can't go wrong in Miami real estate, you knew it was time to sell. That's why an article like the one that ran last week in the respected, mainstream Wall Street Journal helps me to sleep well at night with the knowledge that precious metals still have a long way to go.
The above type of analysis (reading headlines) is useful in estimating the long term tops, but if we want to check what may be in the cards during the next few days, weeks or months, we need to turn to charts (in this essay charts are courtesy of http://stockcharts.com). This week I will begin with the USD Index.
USD Index
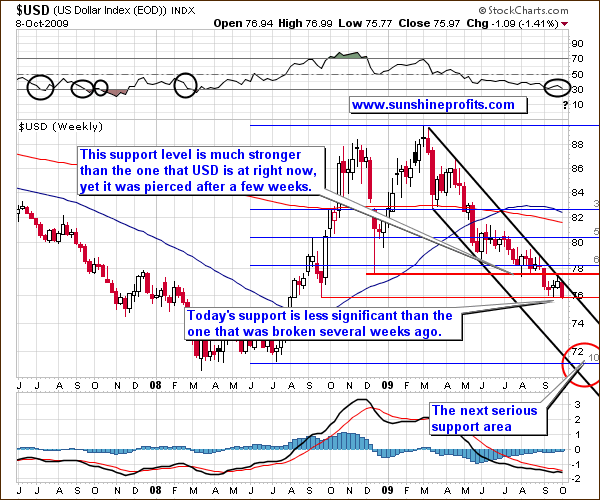
The weekly perspective on the USD Index provides us with a perfect view on how the dollar moved lower after touching the upper border of its declining trend channel. Since there were voices (certainly not mine) that this resistance level will be broken to the upside, the fact that USD in fact resumed its main trend is one of the important news this week.
For now, the support level just below 76 (created by the September 2008 low) has not been broken yet, but it is likely to take place soon, given the prevailing trend, and especially when one compares this support to the one that USD broke through several weeks ago. The December 2008 low (by the way, do you recall the Market Alert that I've sent on Dec 18th 2009, exactly when the low was forming?) was much more significant, yet it took only a few weeks for USD to go below it. Needless to say, it happened just after dollar touched the upper border of the declining trend channel.
This is exactly what took place last week, so it would not surprise me to see dollar lower soon. I realize that the RSI Indicator is currently near the 30 level, which generally means that an asset is undervalued, but please note that most times that this was the case in the past it meant further declines, not rallies. I have marked these situations with black ellipses on the chart.
The particularly interesting thing here is that once we go below the thin red line that marks the previously mentioned support level, we don't have virtually any other support all the way to the 71-72 area. This is obviously much lower than where USD is today, so the implications for the precious metals market could be huge, especially given the strength of gold's reaction to the recent move in USD.
Gold
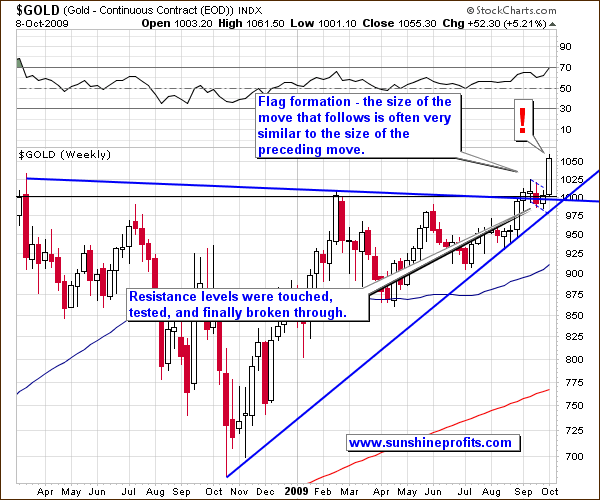
I've used the red exclamation mark as the description of this week's price action, as its consequences are very important. The message of gold above $1,000 goes throughout the worlds and many investors, who were hurt in the stock market, now begin to wonder whether or not precious metals might be a good way to go from now. This is exactly what a bull market needs to move higher - a new buying power. Even if one of the markets driving gold in the short term i.e. the general stock market, moves lower, I would still expect the $1,000 barrier to hold as a support.
Should that take place, it will be the final call to go to the long side of the market and close any remaining short positions that you may have in the sector, as after that I expect gold to form a massive (!) rally. It's too early to say when we'll see another long-term top (I would like to see where the next local top is put, in order to make necessary calculations), but it is likely that the size of the rally will be somewhat similar to what we have seen in 2005/2006 and in late 2007.
As far as the first serious resistance level is concerned, the flag formation, which we have seen in the past several weeks, provides us with useful clues. Generally, the size of the move that follows this formation is very similar to the size of the preceding one, so it may take gold higher to the $105 level or so in the GLD ETF. The short-term charts provide additional insight, but I will leave them to my Subscribers.
As I previously mentioned silver tends to outperform gold, during the final stages of a rally (the bigger the rally, the more visible - and useful - this phenomenon is). Since silver has been rallying strongly in the past few weeks, I believe it might be useful to analyze the silver to gold ratio.
Silver to Gold Ratio
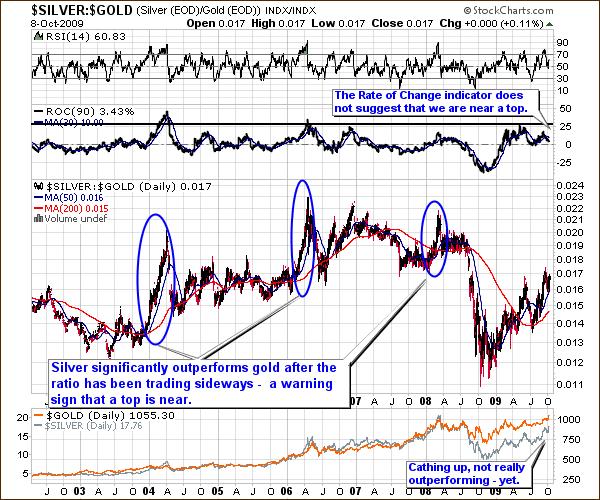
From the long-term perspective (and I believe this one is appropriate here, as we are analyzing long-term price moves), this chart does not have bearish implications. The rally in silver has indeed been sizable, but that is more of a catching up, than outperforming. The 2008 plunge took silver and thus the silver/gold ratio lower, and the white metal is still to recover. This process is under way, and the ratio reflects it.
Please note that the ratio has not been trading sideways before the current rally - it is still bouncing back after the 2008 drop. Another thing that suggests that we are not near a major top in the precious metals is that the Rate of Change (ROC) indicator is much below the 25 level. As a reminder, ROC indicator informs us how much the price of a given security changes in a given period, which is particularly useful in this ratio, as it is its momentum that should make one look for a top.
Summary
As you may see, we are still a long way (in dollar terms) from the top, as being "gold bug" is perceived as strange. Once we get to the point when NOT admitting to be one will be seen as faux pas, we will know that it's time to sell our long-term holdings. This is not what we see, hear, and read today, and it is not likely to be the case anytime soon.
From the short-term point of view, it currently seems that PMs will move a little higher before taking a breather. What happens then depends, to a large extent, on what takes place in the USD Index and on the general stock market.
Currently, it seems that the USD will move lower but it may take at least several days before the plunge accelerates. This would correspond to the abovementioned action in gold, silver and mining stocks.
To make sure that you get immediate access to my thoughts on the market, including information not available publicly, I urge you to sign up for my free e-mail list. Sign up today and you'll also get free, 7-day access to the Premium Sections on my website, including valuable tools and charts dedicated to serious PM Investors and Speculators. It's free and you may unsubscribe at any time.
Save time and money, by using our Premium Service! It saves you a great deal of time, as a large part of the analysis will be done for you. You pull the final strings, but you get a Premium version of our Updates, Alerts, Charts and Tools, which are bound to shorten the time that you need to make your investment- and speculation-related decisions. Saving time means saving money, and additionally - how much did you save by not selling at the beginning of September (recall that you received a free alert from me, in which I recommended holding your positions at that time) and by selling two weeks ago? Join our savvy Subscribers today and take advantage of the full version of the exclusive, premium commentary.
Thank you for reading. Have a great and profitable week!
P. Radomski
--
In the Premium version of this week's analysis, I comment on an investment vehicle that provides you with a convenient way of owning gold in Switzerland that was introduced recently, cover the platinum market with the emphasis on its connection with other PMs, and provide short-term charts with much more details (including an alternative use of the Phi number - 1.618), than what you see in the free version. Additionally, I comment on the recent (critical) action in the general stock market, silver and mining stocks. I also feature the most interesting ETFs, ETNs and mutual funds investing in the PM market.
