
This essay is based on the Premium Update posted on March 5th, 2010. Visit our archives for more gold articles.
In one of our previous essays we mentioned that the situation in the USD Index appears bearish, but it has not been the main driver of the PM prices lately. It's been the general stock market that used to drive gold and silver prices lately, which means that the situation is now less than perfectly bullish, especially in the short term.
Therefore, this week we would like to let you know what we think about the main stock indices and how it may influence the gold market.
Let's begin with the long-term SPY ETF chart, which we often use as a proxy for the general stock market that allows us to analyze volume (charts courtesy of http://stockcharts.com)
In the latest Market Alert we wrote the following:
The general stock market appears to be topping here, or at least the risk of a temporary downturn is high. Given the high short-term correlation between the general stock market and precious metals this means that the risk of a move lower in the metals (and corresponding equities) is also high.
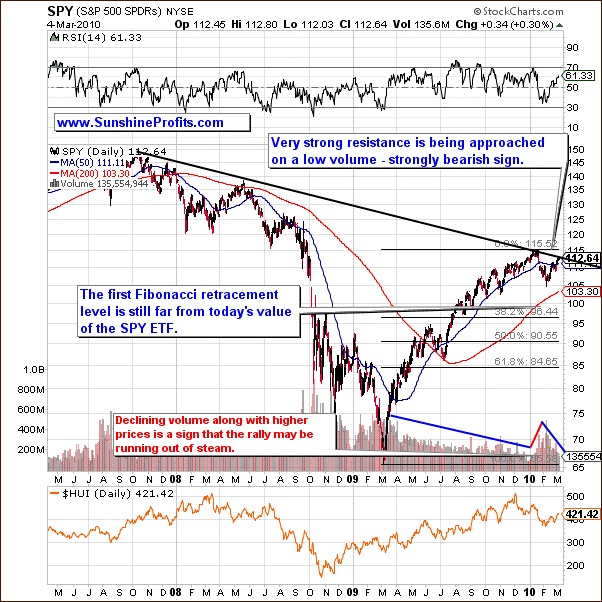
As you may see on the above chart, the SPY ETF (proxy for the general stock market, which allows us to analyze volume) has just moved to the strong long-term resistance level. This level is created by connecting important 2007, 2008 and 2010 tops, so it is in fact a multi-year resistance level. In order to break above such a strong resistance, stocks would need to show some kind of signals of strength. High - and rising - volume during the upswing would clearly provide a confirmation, but we have not seen that recently.
Moreover, we have seen the volume decline along with higher prices. While prices certainly may move temporarily higher, based on the historical performance of this market (and other ones as well) it is not likely that the general stock market will move much above such a strong resistance level right away.
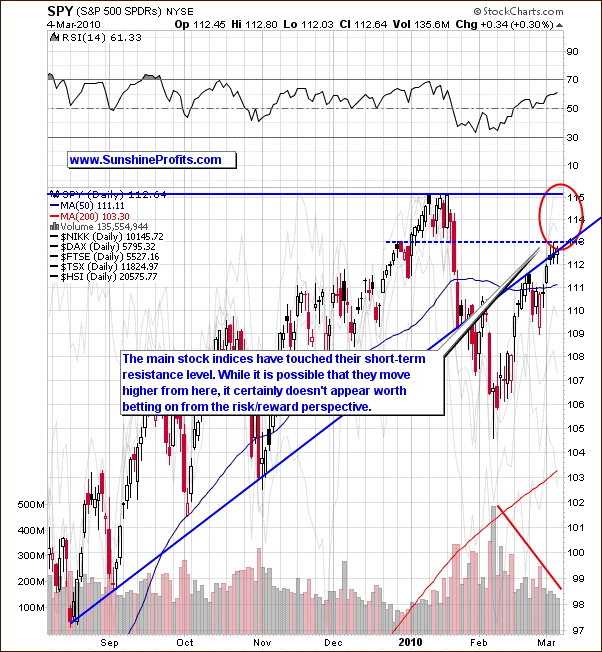
The analysis of the short-term chart confirms the abovementioned point. The SPY ETF is not only right at the strong long-term resistance level - it has also just touched the short-term resistance area. The volume is relatively low also from the short-term perspective and it has been declining during the current upswing.
Therefore, betting on higher values of the main stock indices doesn't seem to be justified from the risk/reward point of view. Whether or not to short the general stock market is a different matter. Situation is not symmetrical, meaning that the fact that the general stock market is not likely to rise doesn't automatically mean that it plunges right away - after all, it may continue to trade sideways for weeks.
Additionally, if one is considering using options for this bet (which is often a good idea for betting on lower prices, because declines tend to be more volatile than upswings as fear is a strong emotion than greed and options' value increases along with volatility - you may read more in one of our previous essays), it is imperative not to purchase short-term options just before a consolidation, during which prices trade sideways. Options have time value, which means that their price will decrease over time (very fast in case of short-term options) unless the underlying asset will move in the predicted way.
Therefore, before initiating a short position it might be useful to wait for additional confirmation that the move lower is to take place soon, for instance in the form of a decline on a high volume followed by an upswing on much lower volume.
Moving on to the gold market itself - given the recent high influence of the general stock market on the prices of precious metals, the abovementioned points mean that one can expect gold to move lower from here.
In the Feb 26th Premium Update, we wrote the following:
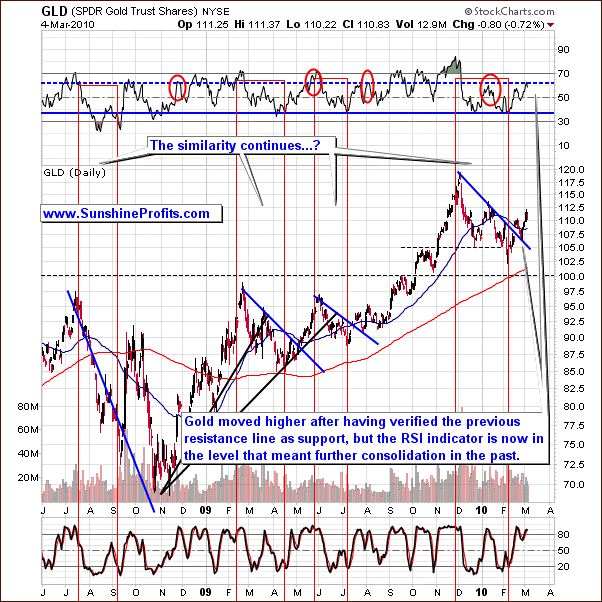
As we can observe on the GLD chart above, the values follow a consistently similar trend. After breaking above the declining short-term resistance lines (marked on the chart with blue color), gold moves lower to test the previous resistance. That was the case also this time as gold has just verified the previous resistance line as a support.
Gold has indeed moved higher during the following days, but it seems that it will need to take a breather once again. Please take a look at the RSI Indicator - it's currently near the 60 level. Please note that this used to signal that a temporary top has been reached - we've marked these situations with red ellipses on the above chart.
We also wrote that gold is warming up and preparing to launch higher [from the long-term perspective]. If only gold can break free from its strong positive correlation with the general stock market, then one can assume that the gold market will most likely climb its way up.
Summing up, the situation on the general stock market remains bearish even though we have seen it move higher recently. As mentioned above, we have not seen the disconnection between gold and the general stock market, so we must remain cautious. The full version of this essay, but we will leave the short-term charts with timing details for our Subscribers.
To make sure that you are notified once the new features are implemented, and get immediate access to my free thoughts on the market, including information not available publicly, I urge you to sign up for my free e-mail list. Sign up today and you'll also get free, 7-day access to the Premium Sections on my website, including valuable tools and charts dedicated to serious PM Investors and Speculators. It's free and you may unsubscribe at any time.
Thank you for reading. Have a great and profitable week!
P. Radomski
--
The situation in the Eurozone remains tense, which is a positive fundamental information for the USD Index. The general stock market is approaching a very strong resistance level, but still managed to rise today. What does it mean for the Precious Metals Investors? You will find answers to this, and many other questions in this week's Premium Update.
This week's Premium Update contains 17 detailed charts/tables and over 4000 words of thorough analysis dedicated to explaining the logic behind the points made in the latest Market Alert. Not only have we covered the long- and short-term situation in the USD Index, the general stock market, gold, silver, ad precious metals stocks, but we also commented on connections between these markets.
For instance, different techniques applied to silver and gold link today's situation on these markets to one of the previous ones, which greatly improves the overall accuracy of the analysis.
We have also commented on the recent signal from one of our unique indicators, and the ones coming from the GDX:SPY ratio chart and the Gold Miners Bullish Percent Index - possibly a powerful combination.
Moreover, this issue includes rankings of top gold and silver juniors. Additionally, we provide you with a chart featuring prices of juniors relative to gold itself, and comment on the outlook for this particular sector given the bearish situation in the main stock indices. We encourage you to Subscribe to the Premium Service today and read the full version of this week's analysis right away.
Back