
Earlier today, the U.S. dollar moved lower against the euro and the yen. Nevertheless, the greenback rose against the Canadian dollar, British pound and Swiss franc as expectations for further reductions in the Fed’s stimulus program still serve as support for the U.S currency. Did these moves change the outlook for major currency pairs? If you want to know our take on this question, we invite you to read our today's Forex Trading Alert.
Forex Trading Positions - Summary:
EUR/USD
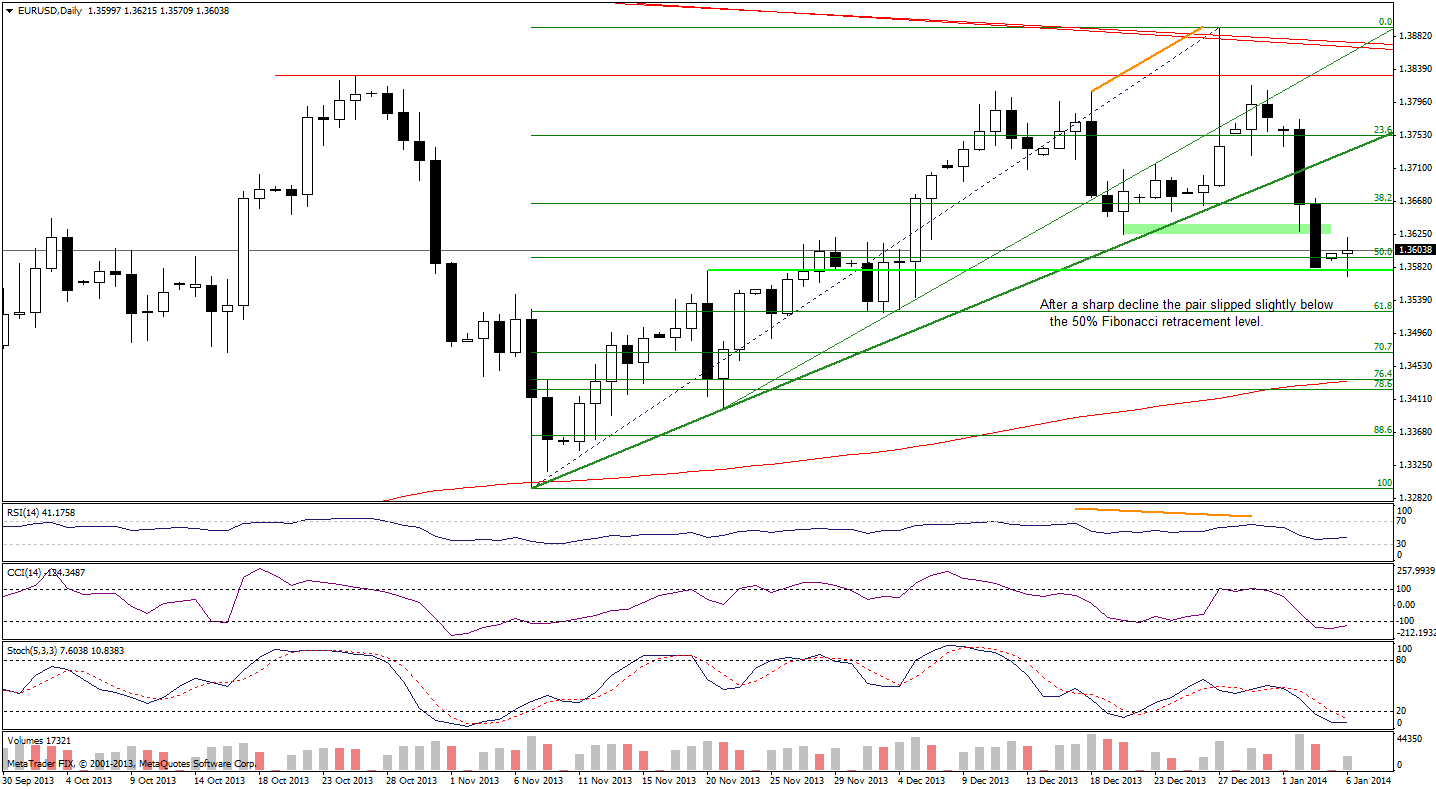
On the above chart, we see that EUR/USD extended its decline on Friday and dropped below the 50% Fibonacci retracement level based on the entire Nov. - Dec. rally. With this downward move, the pair also reached the Nov. 20 high. If this support zone encourages the buyers to act, we will likely see a pause or an upswing from this area. However, if it is broken, we will likely see further deterioration and, in this case, the downside target will be around 1.3524 where the 61.8% Fibonacci retracement level intersects with the Dec. 3 low.
Very short-term outlook: bearish
Short-term outlook: mixed with bearish bias
MT outlook: mixed
LT outlook: bearish
Trading position (short-term): we do not suggest opening any trading positions at the moment. We will keep you informed should anything change, or should we see a confirmation/invalidation of the above.
GBP/USD
Quoting our previous Forex Trading Alert:
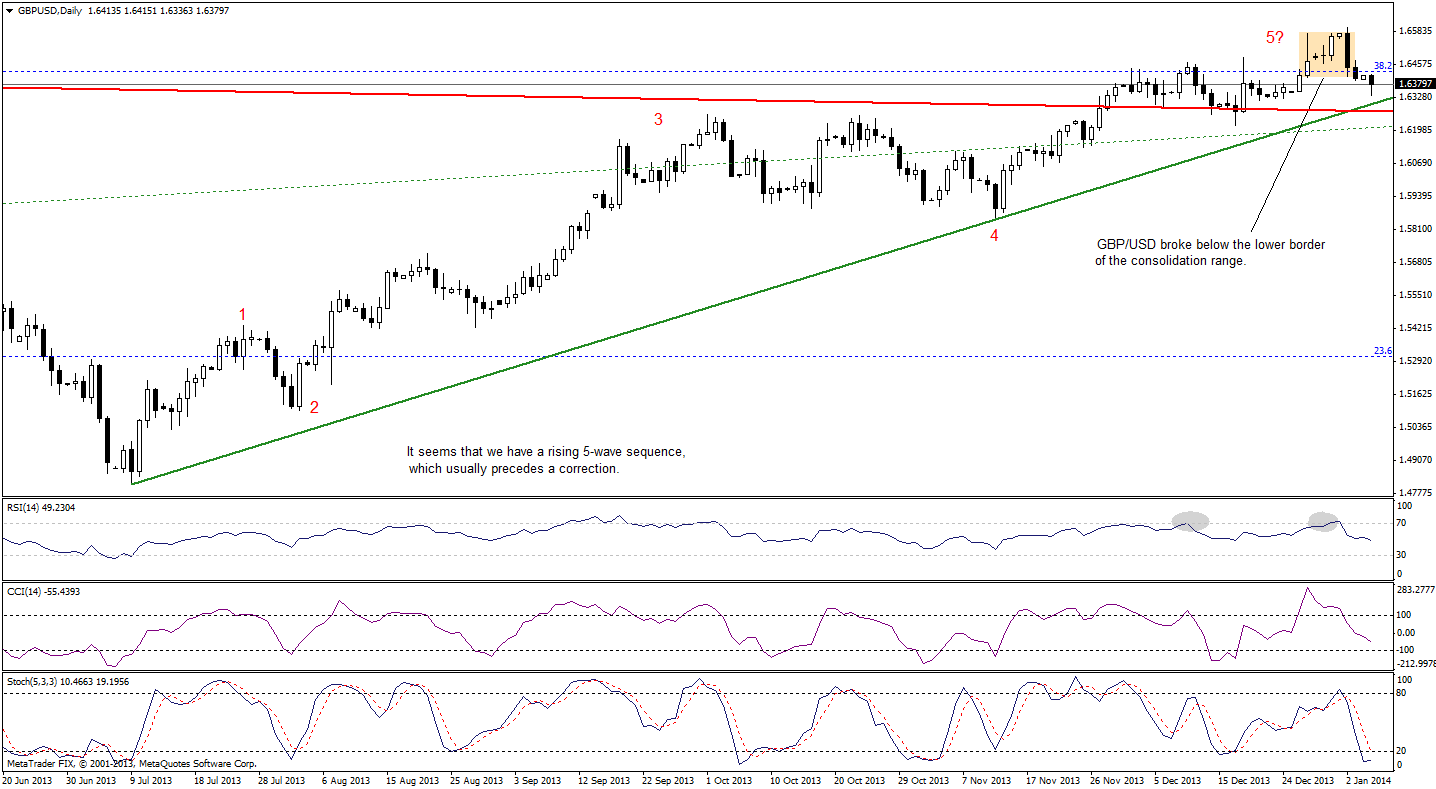
(…) the pound declined below Tuesday’s low, which resulted in a bearish reversal candlestick pattern – an evening star. This bearish candlestick pattern encouraged sellers to act and they triggered a downward move which took the pair below the lower border of the recent consolidation, which is a bearish signal.
On the above chart, we see that GBP/USD declined once again and approached the green short-term rising support line. Nevertheless, it still remains above this line (and also above the red long-term support line) and the current correction is similar to the previous one, which is a positive sign for the buyers. Therefore another upswing should not surprise us.
Very short-term outlook: mixed
Short-term outlook: bullish
MT outlook: bullish
LT outlook: mixed
Trading position (short-term): we do not suggest opening any trading positions at the moment. If the pound drops below the red long-term support line, we will consider opening speculative short positions. We will keep you informed should anything change, or should we see a confirmation/invalidation of the above.
USD/JPY
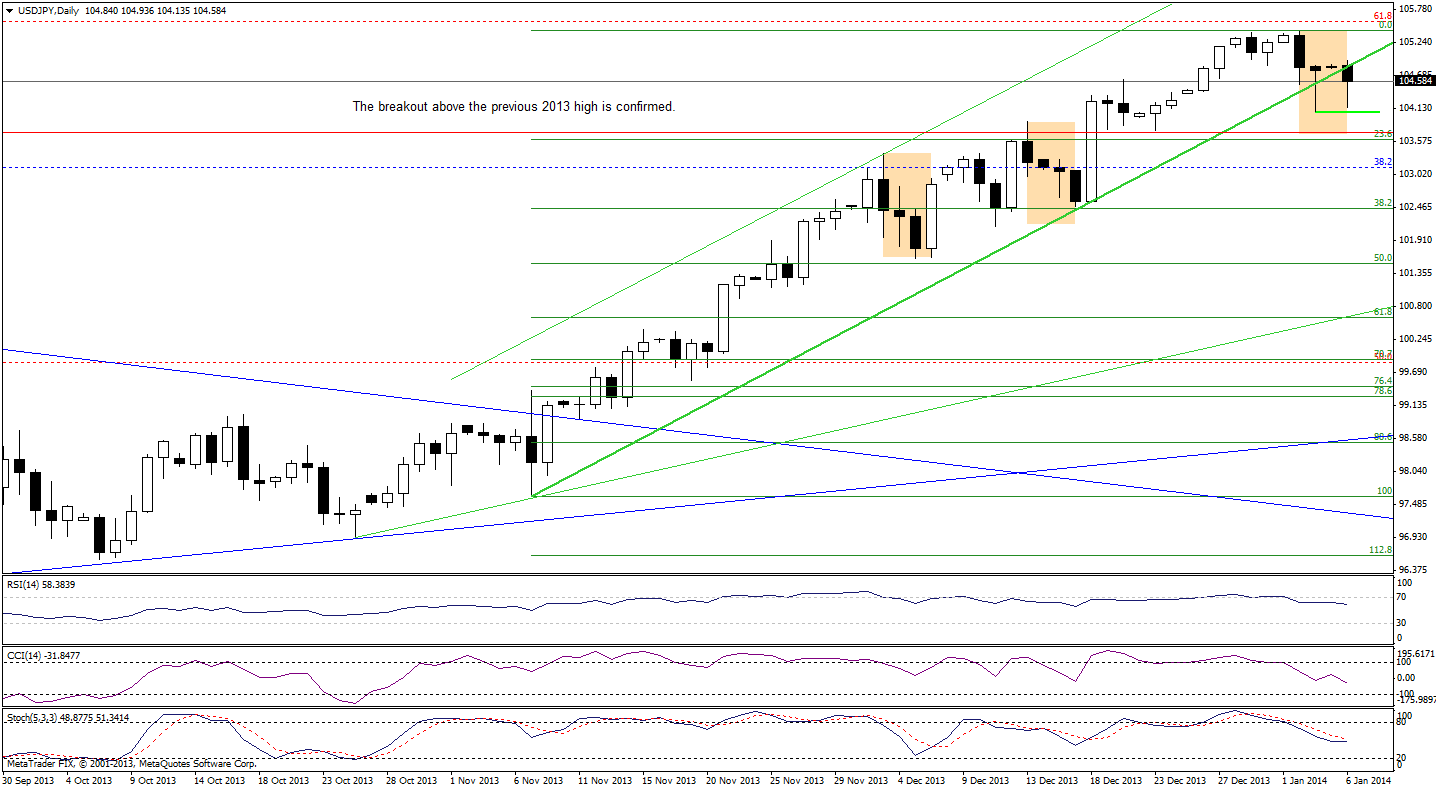
Looking at the above chart, we see that USD/JPY dropped below the short-term rising line once again. From this perspective, it seems that the pair verified the breakdown, which is a negative signal. However, the breakdown is not confirmed at the moment and the correction is still shallow (smaller than the previous ones), which prescribes caution. Additionally, long lower shadows suggest that the buyers do not give up so easy. Please note that even if the pair drops to 103.67, the current correction will be similar to the previous ones and the uptrend will be not threatened.
Very short-term outlook: mixed
Short-term outlook: bullish
MT outlook: bullish
LT outlook: bearish
Trading position (short-term): we do not suggest opening any trading positions at the moment. We will keep you informed should anything change, or should we see a confirmation/invalidation of the above.
USD/CAD
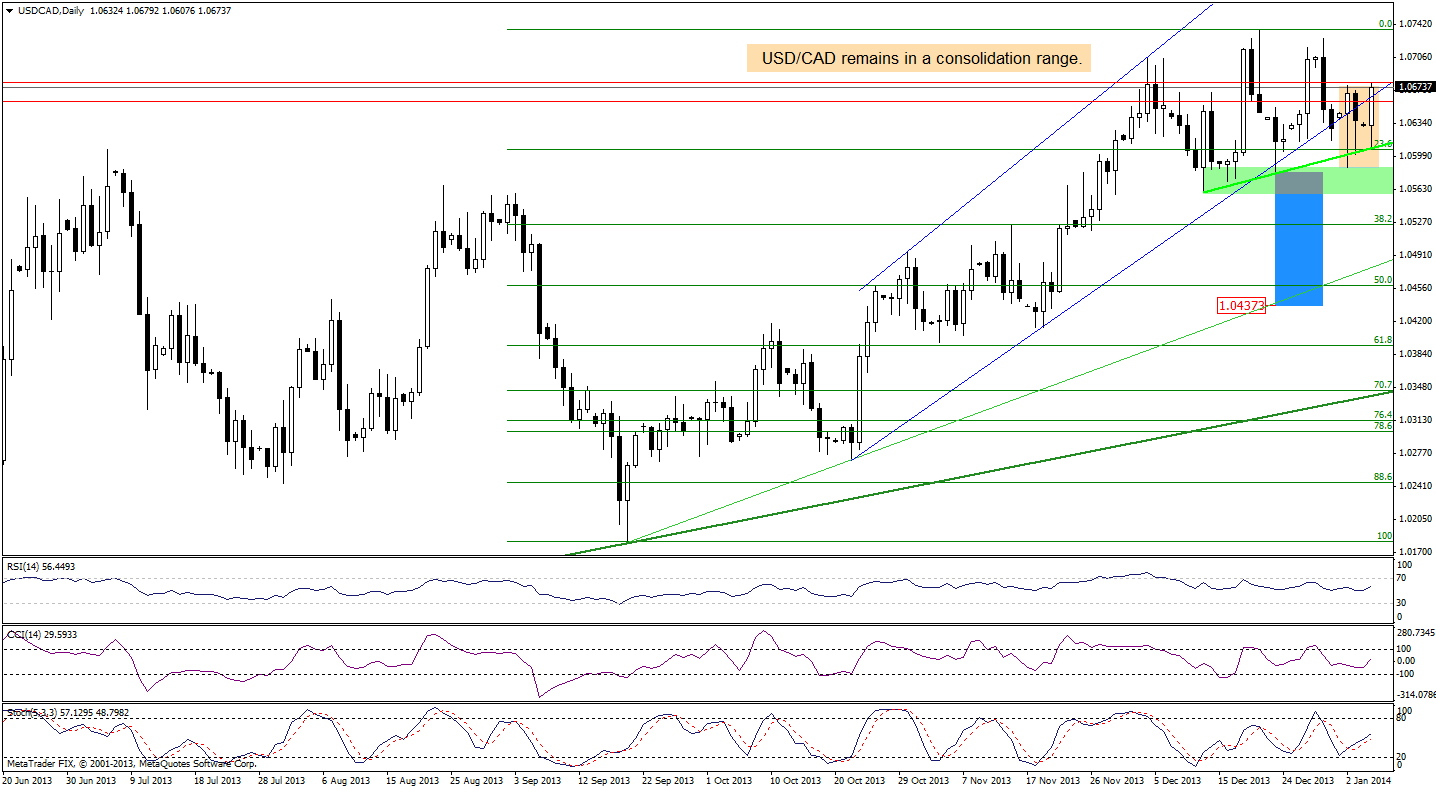
On the above chart, we see that earlier today, USD/CAD invalidated the breakdown below the lower border of the rising trend channel – similarly to what we had seen in previous days. Although this is a positive signal, an upswing that we see at the moment is similar to the previous one and the pair remains in a consolidation range. Therefore, if USD/CAD moves higher (above 1.068), we will likely see an upward move to the Dec. 30 high (or even to the 2013 peak). This scenario is reinforced by the position of the indicators – the Stochastic Oscillator generated a buy signal and the RSI is not overbought and still has space for further growth.
However, if the buyers fail and the pair confirms the breakdown below the lower border of the rising trend channel, the downside target for the sellers will be around 1.0459 where the 50% Fibonacci retracement level (based on the entire Sept. - Dec. rally) is. Additionally, if the pair drops below the Dec. 23 low, we could have a double top decline. In this case, the price target for the pattern would be around 1.0437.
Very short-term outlook: mixed
Short-term outlook: mixed
MT outlook: bullish
LT outlook: bearish
Trading position (short-term): we do not suggest opening any trading positions at the moment. We will keep you informed should anything change, or should we see a confirmation/invalidation of the above.
USD/CHF
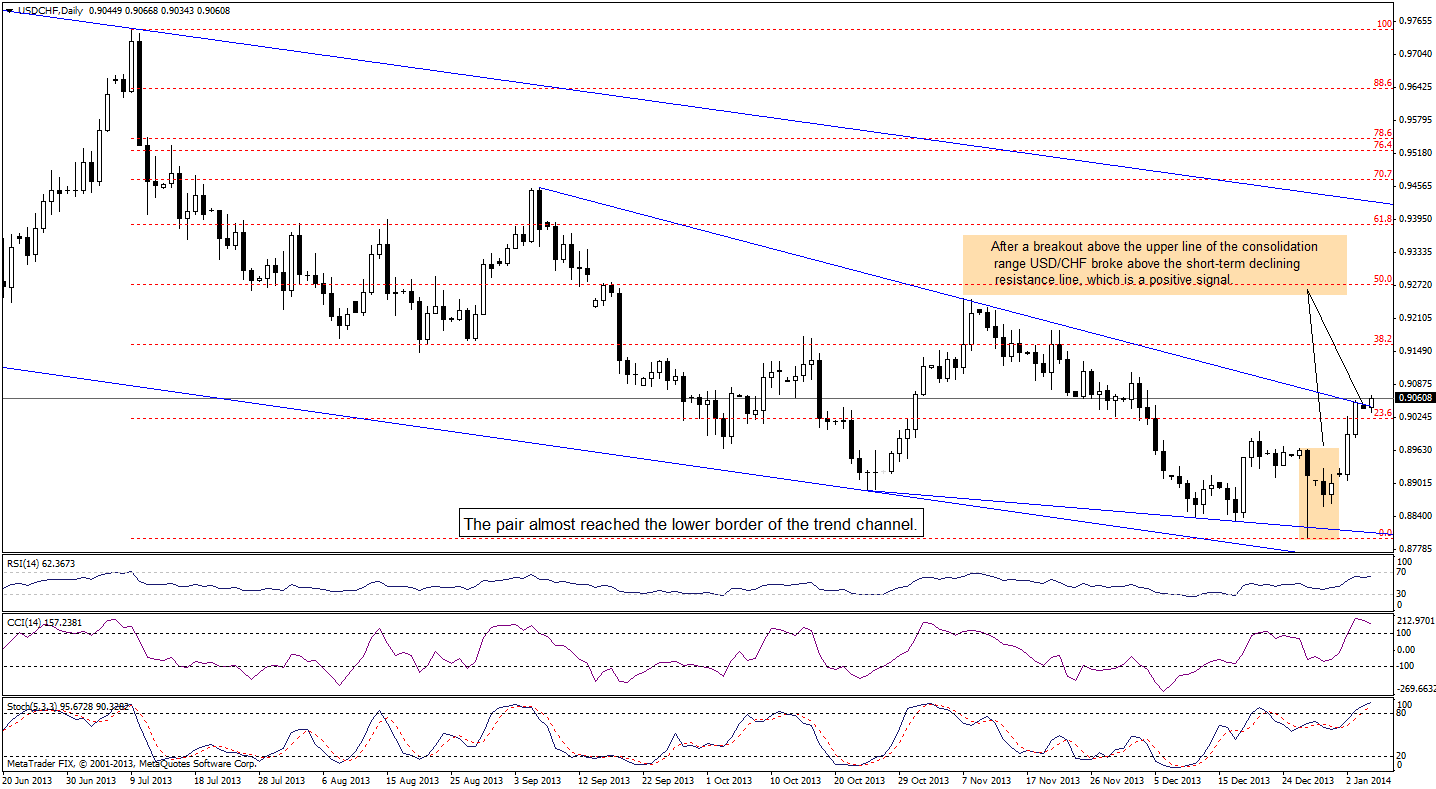
Looking at the above chart, we see that the situation has improved once again. After a breakout above the upper line of the consolidation range, USD/CHF extended its growth and broke above the short-term declining resistance line based on the September and November high, which is a bullish signal. In this way, the short-term situation improved and the nearest upside target for the buyers is the 38.2% Fibonacci retracement level based on the Jul. - Dec. decline.
Very short-term outlook: mixed with bullish bias
Short-term outlook: bearish
MT outlook: bearish
LT outlook: bearish
Trading position (short-term): we do not suggest opening any trading positions at the moment. We will keep you informed should anything change, or should we see a confirmation/invalidation of the above.
Thank you.
Nadia Simmons
Forex & Oil Trading Strategist
Oil Investment Updates
Oil Trading Alerts
