
Earlier today, the outlook for the greenback against major currencies was mixed as market players eyed a speech by Federal Reserve Chairman Ben Bernanke later in the day. On Friday, the euro hit a fresh two-week low against the U.S. dollar, while the U.S. currency fell from five-year highs against the yen. What happened with the other three currency pairs? If you want to know our take on this question, we invite you to read our today's Forex Trading Alert.
Forex Trading Positions - Summary:
EUR/USD
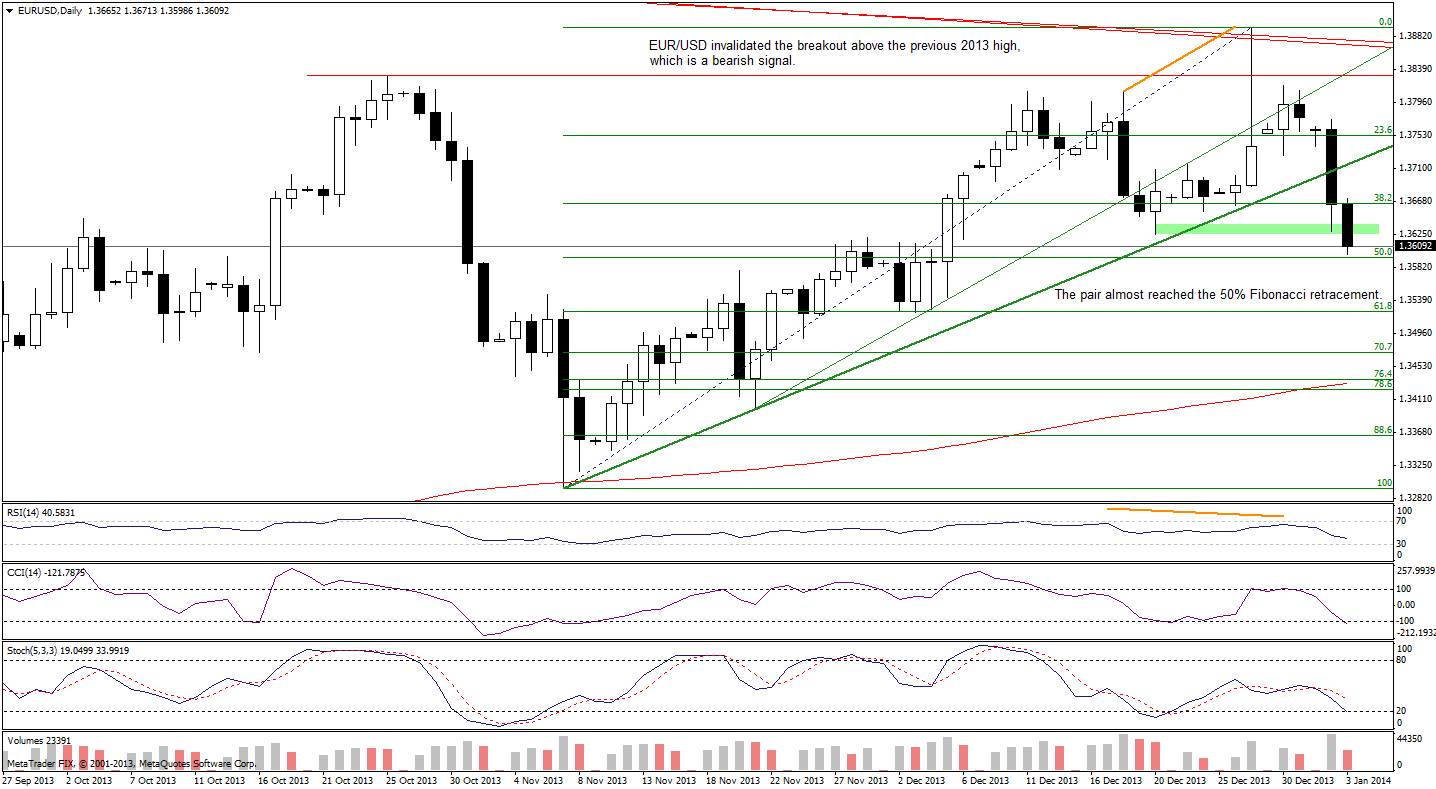
On the above chart, we see that EUR/USD extended its decline below the short-term support line. Yesterday, the pair dropped below the 38.2% Fibonacci retracement level based on the entire Nov. - Dec. rally and reached the downside target (the Dec. 20 low).
Although this support level encouraged the buyers to act, we didn’t see a bigger upward correction yesterday. Instead, earlier today EUR/USD declined once again and almost reached the 50% Fibonacci retracement, therefore, we could see a pause or an upswing from this area. However, if it is broken, we will likely see further deterioration and, in this case, the downside target will be around 1.3524 where the 61.8% Fibonacci retracement level intersects with the Dec. 3 low.
Very short-term outlook: bearish
Short-term outlook: mixed with bearish bias
MT outlook: mixed
LT outlook: bearish
Trading position (short-term): we do not suggest opening any trading positions at the moment. We will keep you informed should anything change, or should we see a confirmation/invalidation of the above.
GBP/USD
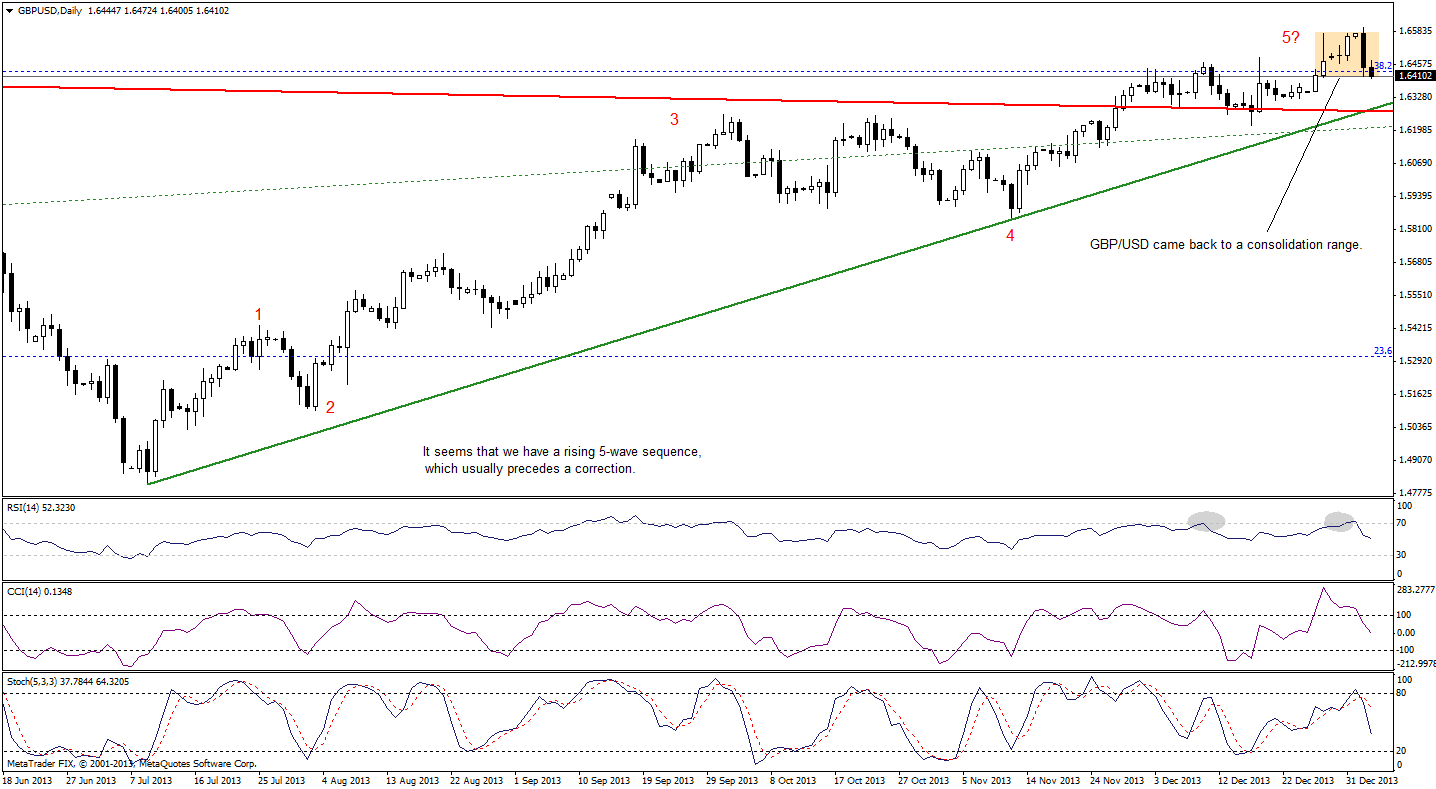
On the above chart, we see that the pound declined below Tuesday’s low, which resulted in a bearish reversal candlestick pattern – an evening star. This bearish candlestick pattern encouraged sellers to act and they triggered a downward move which took the pair below the lower border of the recent consolidation, which is a bearish signal.
On top of that, the RSI declined below the level of 70 and the CCI and Stochastic Oscillator generated sell signals, which suggests further declines.
Taking the above into account, we should keep in mind what we wrote in our Forex Trading Alert on Monday:
(…) we can notice a rising 5-wave sequence on the above chart (…) according to the Elliott wave theory, this complete sequence usually precedes a correction and if that is the case, the pound will likely drop against the U.S. dollar in the near future. (…) if the pound drops below the red long-term support line (which currently intersects with the green short-term rising support line), it will likely trigger a bigger corrective move.
Very short-term outlook: mixed with bearish bias Short-term outlook: bullish MT outlook: bullish LT outlook: mixed
Trading position (short-term): we do not suggest opening any trading positions at the moment. If the pound drops below the red long-term support line (which currently intersects with the green short-term rising support line), we will consider opening speculative short positions. We will keep you informed should anything change, or should we see a confirmation/invalidation of the above.
USD/JPY
In our last Forex Trading Alert, we wrote the following:
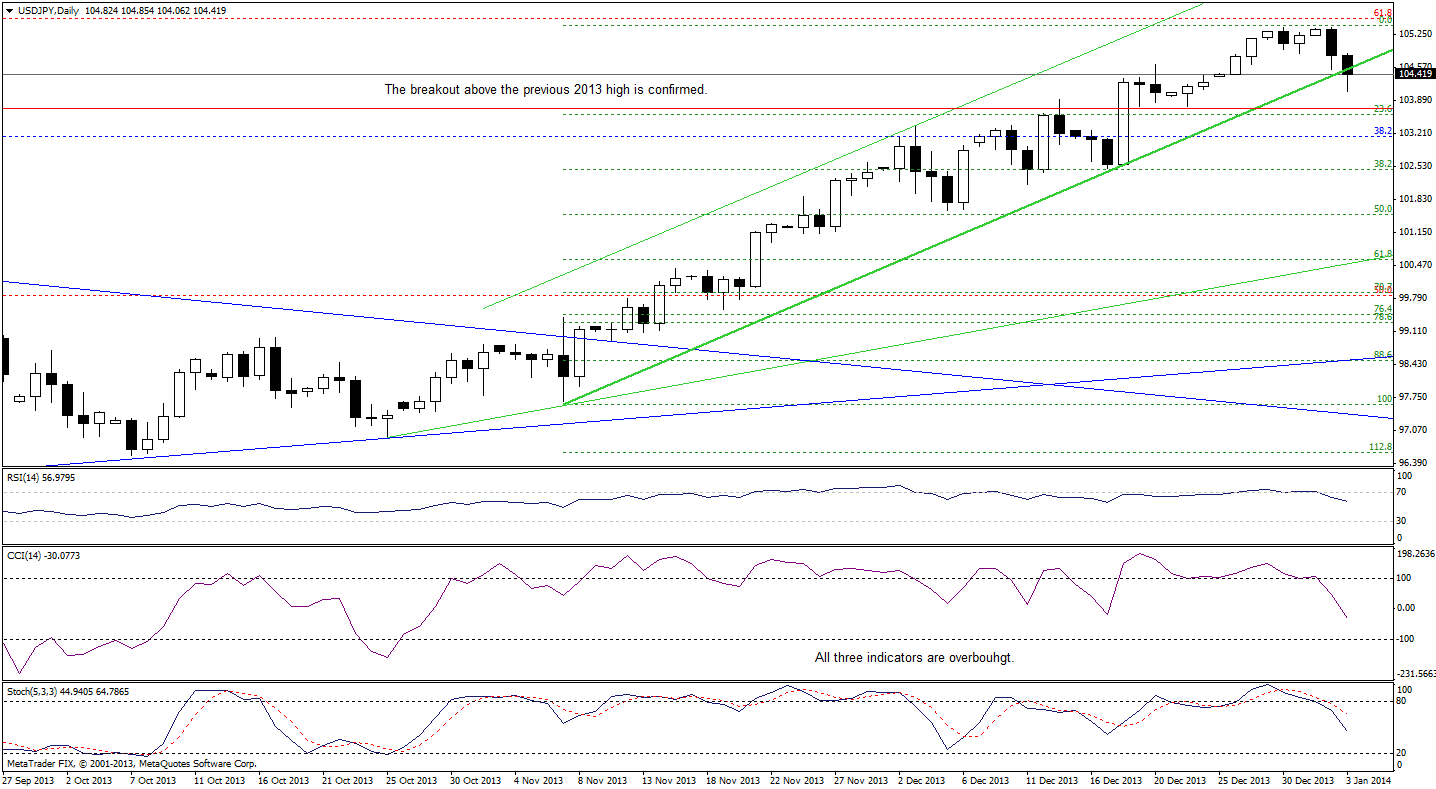
(…) USD/JPY still remains below the strong resistance levels (the 61.8% Fibonacci retracement and the long-term declining resistance line), which may encourage the sellers to act. Additionally, the RSI slipped below the level of 70 and both other indicators are overbought, which suggests that we could see another correction in the coming days. Please note that the nearest important support is the short-term rising line (which is also the lower border of the rising trend channel) based on the Nov. 7 and Dec. 18 lows. If it is broken, a bigger corrective move is likely to be seen.
Looking at the above chart, we see that USD/JPY actually slipped below the short-term rising line, which suggests further declines. However, the breakdown is not confirmed at the moment and the correction is still shallow (smaller than the previous ones).
Very short-term outlook: mixed with bearish bias
Short-term outlook: bullish
MT outlook: bullish
LT outlook: bearish
Trading position (short-term): we do not suggest opening any trading positions at the moment. However, if the pair confirms the breakdown below the short-term rising support line (and confirms the breakdown) we will consider opening speculative short positions. We will keep you informed should anything change, or should we see a confirmation/invalidation of the above.
USD/CAD
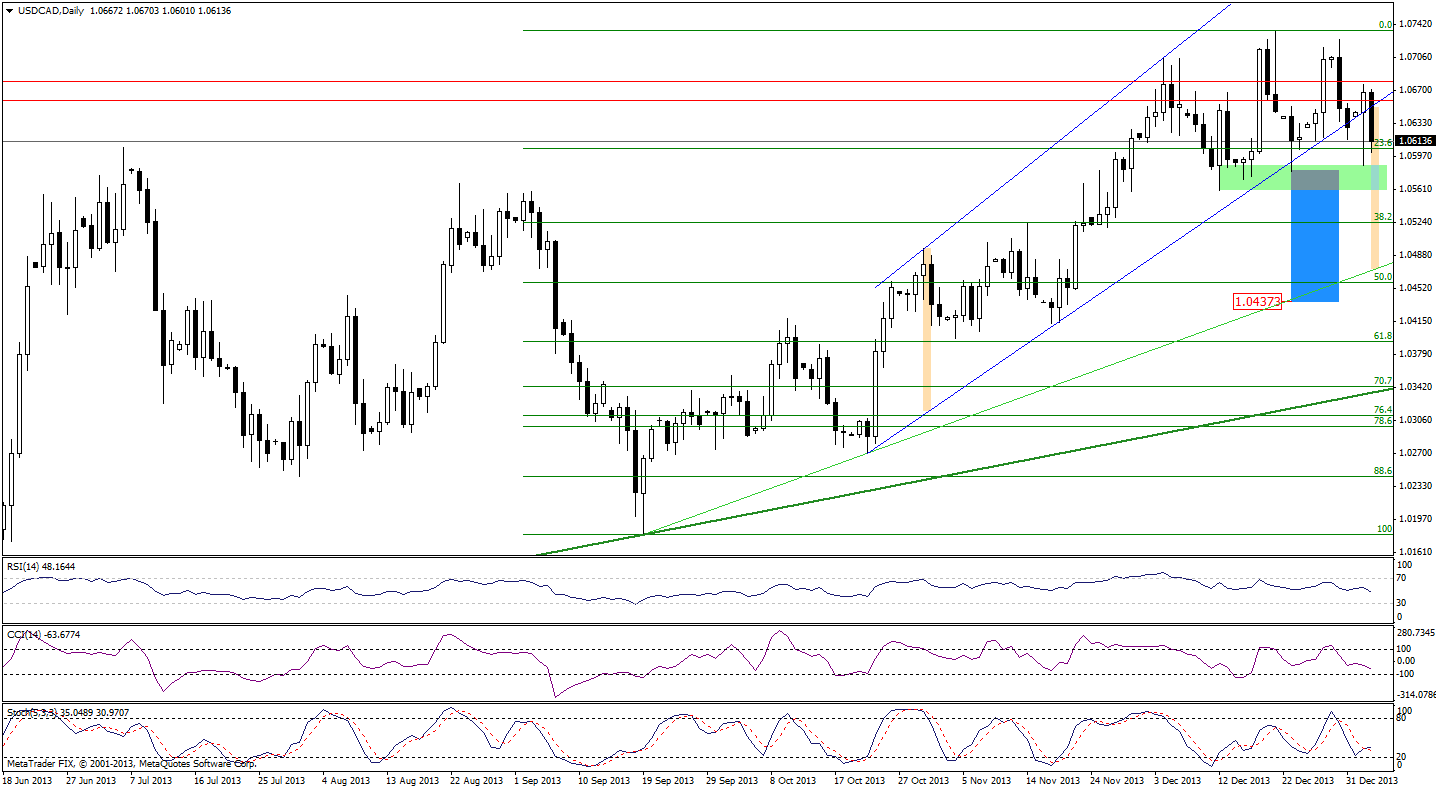
On the above chart, we see that yesterday USD/CAD slipped below the lower border of the rising trend channel and almost immediately invalidated the breakdown – similarly to what we had seen in previous days. Although this was a positive signal, an upswing that we saw was quite small and didn’t change the situation. Earlier today, USD/CAD declined below the lower border of the rising trend channel once again and so far, the breakdown hasn’t been invalidated, which is a bearish sign.
Nevertheless, as long as the pair remains above the Dec. 23 low, a bigger decline is not a sure bet because we already saw a small decline below the lower border of the rising trend channel, which was almost immediately invalidated.
Please note that if the pair confirms the breakdown below the lower border of the rising trend channel, the downside target for the sellers will be around 1.0459 where the 50% Fibonacci retracement level (based on the entire Sept. - Dec. rally) is. Additionally, if the pair drops below the Dec. 23 low, we could have a double top decline. In this case, the price target for the pattern would be around 1.0437.
Very short-term outlook: mixed with bearish bias
Short-term outlook: mixed
MT outlook: bullish
LT outlook: bearish
Trading position (short-term): we do not suggest opening any trading positions at the moment. However, if the pair confirms the breakdown below the lower border of the rising trend channel, we will consider opening speculative short positions. We will keep you informed should anything change, or should we see a confirmation/invalidation of the above.
USD/CHF
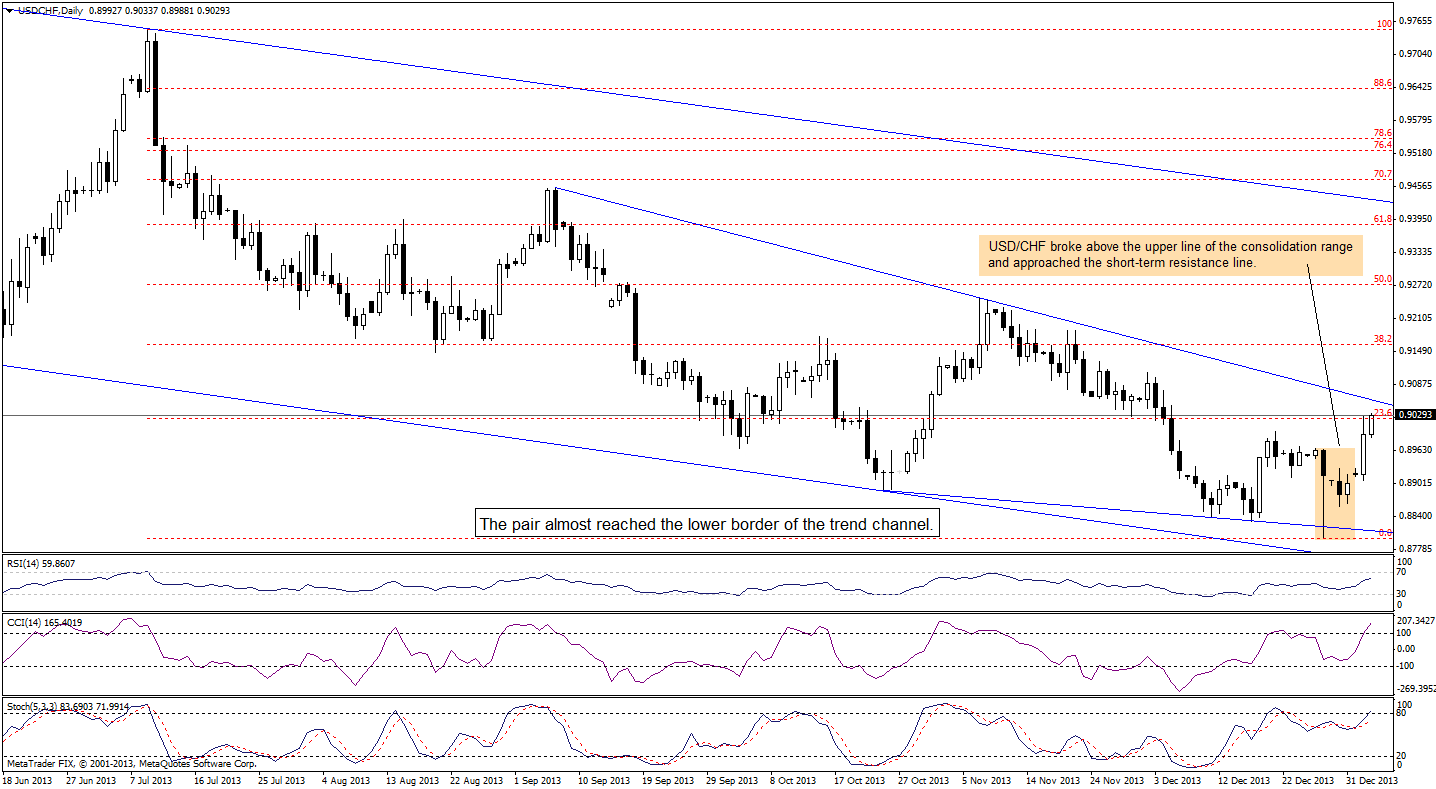
Looking at the above chart, we see that the situation has improved on a very short-term basis once again. After a breakout above the upper line of the consolidation range, USD/CHF extended its growth and approached the short-term declining resistance line based on the September and November highs. Despite this increase, the short-term trend remains down, at least as long as the pair is trading below this resistance line.
If it is broken, the short-term situation will improve and the upside target for the buyers will be the 38.2% Fibonacci retracement level based on Jul. - Dec. decline.
Very short-term outlook: mixed with bullish bias
Short-term outlook: bearish
MT outlook: bearish
LT outlook: bearish
Trading position (short-term): we do not suggest opening any trading positions at the moment. We will keep you informed should anything change, or should we see a confirmation/invalidation of the above.
Thank you.
Nadia Simmons
Forex & Oil Trading Strategist
Oil Investment Updates
Oil Trading Alerts
