
Earlier today, the U.S. dollar improved as the Commerce Department said that the U.S. trade deficit narrowed to USD34.25 billion in November from a revised deficit of USD39.33 billion in the previous month (while economists expected the U.S. trade deficit to widen to USD40 billion). What impact did it have on major currency pairs? If you want to know our take on this question, we invite you to read our today's Forex Trading Alert.
Forex Trading Positions - Summary:
EUR/USD
Quoting our last Forex Trading Alert:
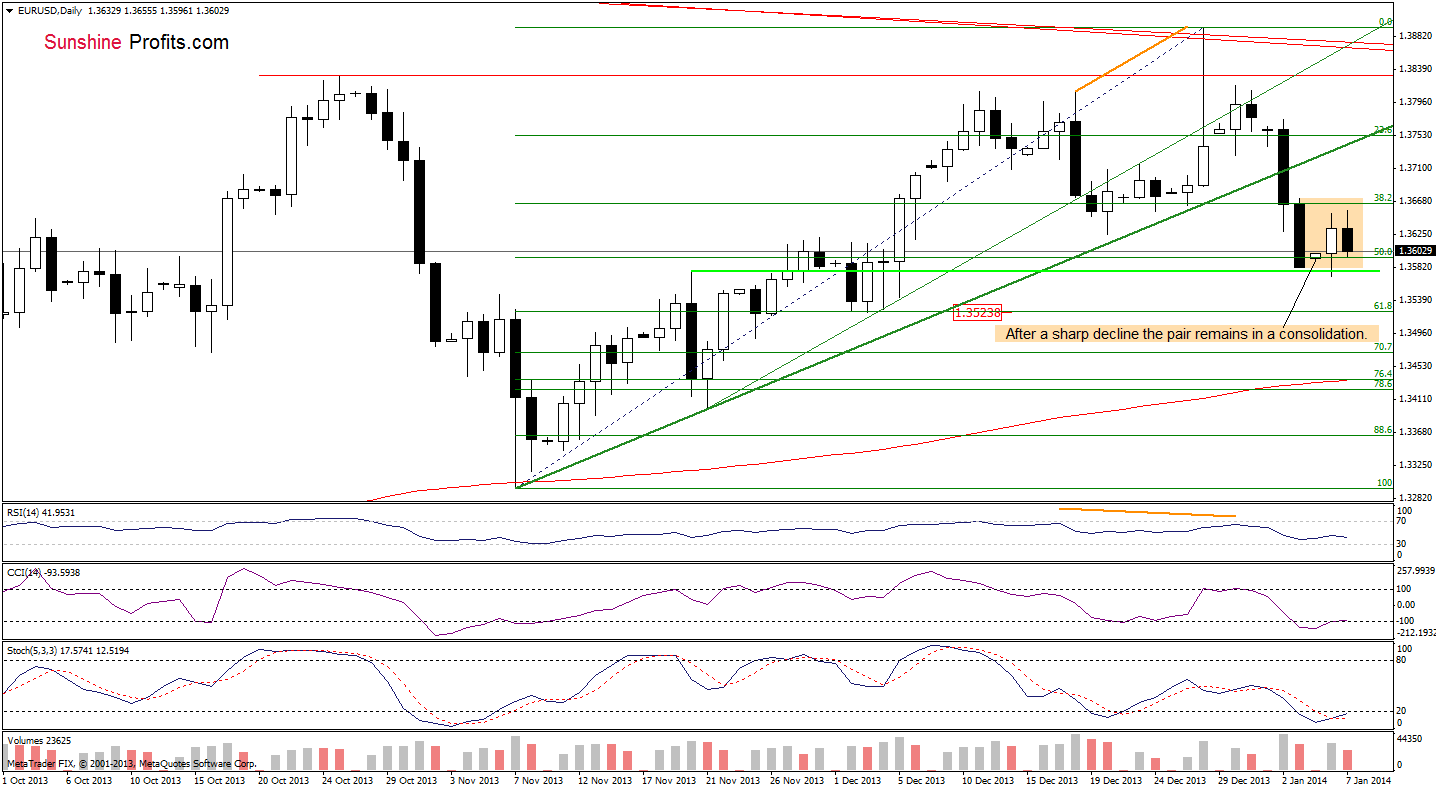
(…) EUR/USD (…) dropped below the 50% Fibonacci retracement level based on the entire Nov. - Dec. rally. With this downward move, the pair also reached the Nov. 20 high. If this support zone encourages the buyers to act, we will likely see a pause or an upswing from this area.
Looking at the above chart, we see that yesterday EUR/USD rebounded. However, this upswing didn’t change the situation. As you see on the daily chart, the pair remains in a consolidation range and it seems that the breakout/breakdown above/below the upper/lower line will trigger another move.
If the buyers win, we will likely see an upswing to the previously-broken short-term rising resistance line. However, if they fail and the pair drops below yesterday’s low, we will likely see further deterioration and, in this case, the downside target will be around 1.3524 where the 61.8% Fibonacci retracement level intersects with the Dec. 3 low.
Very short-term outlook: bearish
Short-term outlook: mixed with bearish bias
MT outlook: mixed
LT outlook: bearish
Trading position (short-term): we do not suggest opening any trading positions at the moment. We will keep you informed should anything change, or should we see a confirmation/invalidation of the above.
GBP/USD
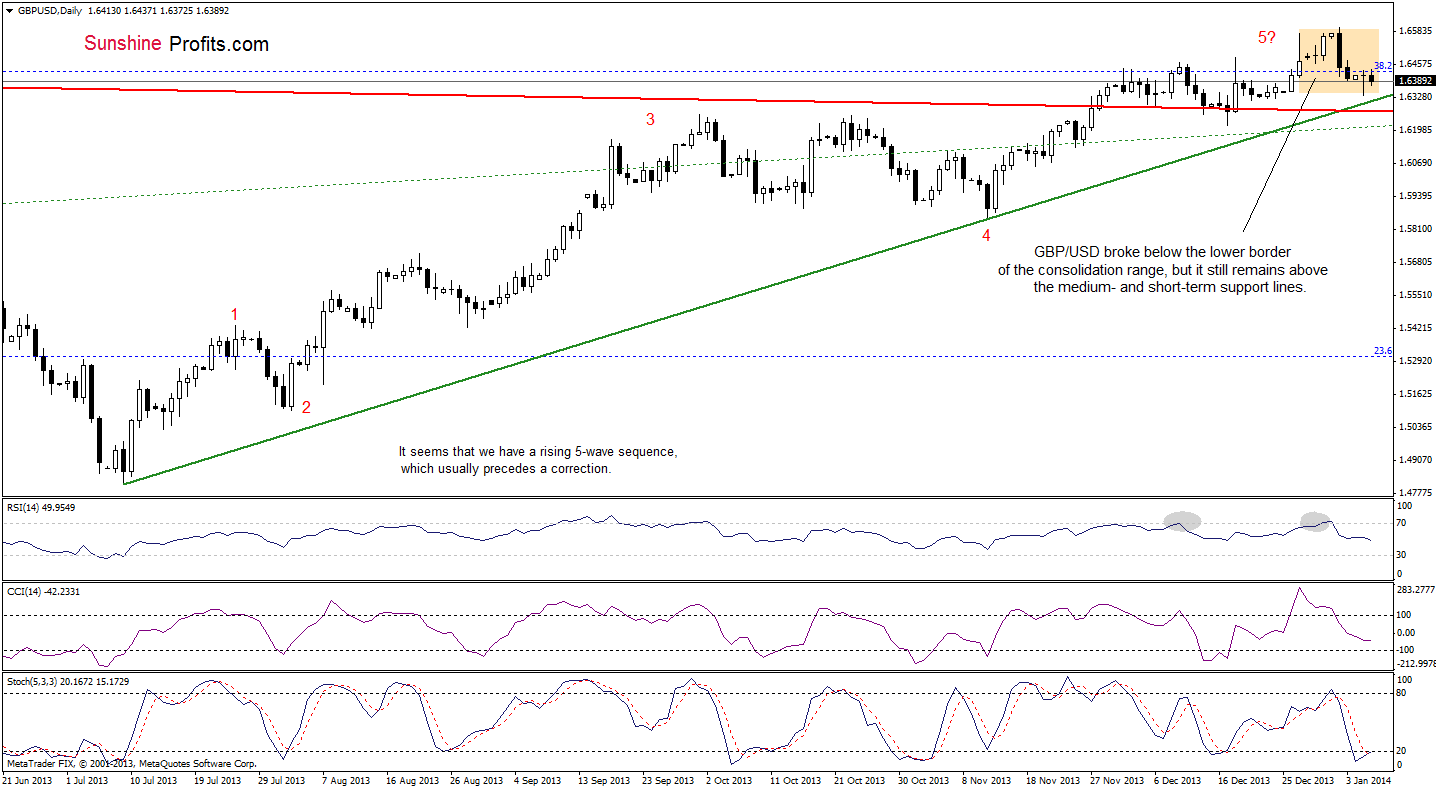
On the above chart, we see that the situation hasn’t changed much. GBP/USD still remains above the green short-term rising support line (and also above the red long-term support line) and the current correction is similar to the previous one, which is a positive sign for the buyers. From this perspective, as long as GBP/USD remains above both support lines, space for further declines seems limited.
Very short-term outlook: mixed
Short-term outlook: bullish
MT outlook: bullish
LT outlook: mixed
Trading position (short-term): we do not suggest opening any trading positions at the moment. If the pound drops below the red long-term support line, we will consider opening speculative short positions. We will keep you informed should anything change, or should we see a confirmation/invalidation of the above.
USD/JPY
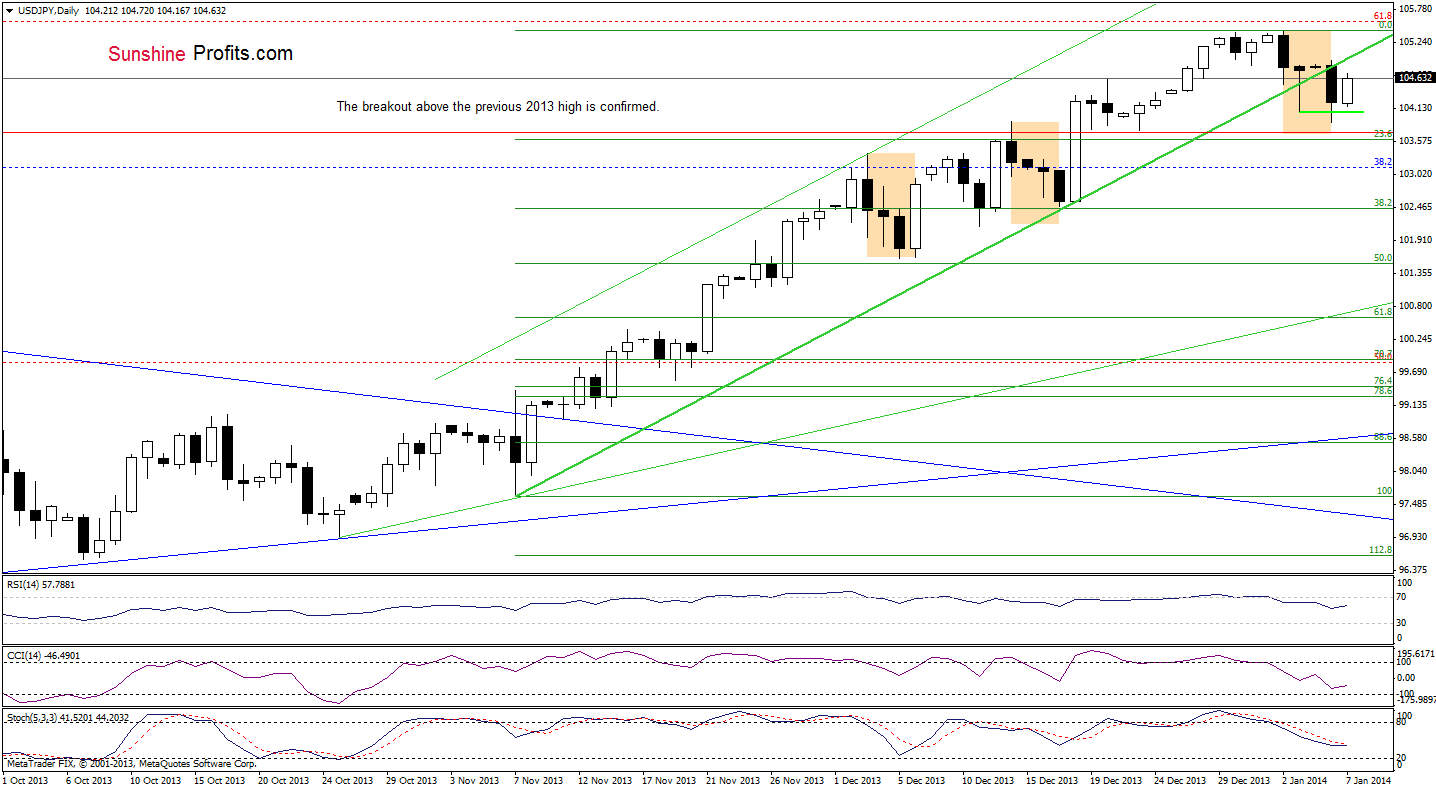
Looking at the above chart, we see that USD/JPY extended its decline below the short-term rising line. Despite this drop, the correction is still shallow (smaller than the previous ones), which is a bullish signal. Please note that even if the pair drops to 103.67, the current correction will be similar to the previous ones and the uptrend will not be threatened.
We should also keep in mind that the breakdown is not confirmed at the moment and, as you see on the above chart, earlier today the U.S. dollar rose against the yen erasing most of yesterday’s drop, which is another positive sign.
Very short-term outlook: mixed
Short-term outlook: bullish
MT outlook: bullish
LT outlook: bearish
Trading position (short-term): we do not suggest opening any trading positions at the moment. We will keep you informed should anything change, or should we see a confirmation/invalidation of the above.
USD/CAD
Quoting our previous Forex Trading Alert:
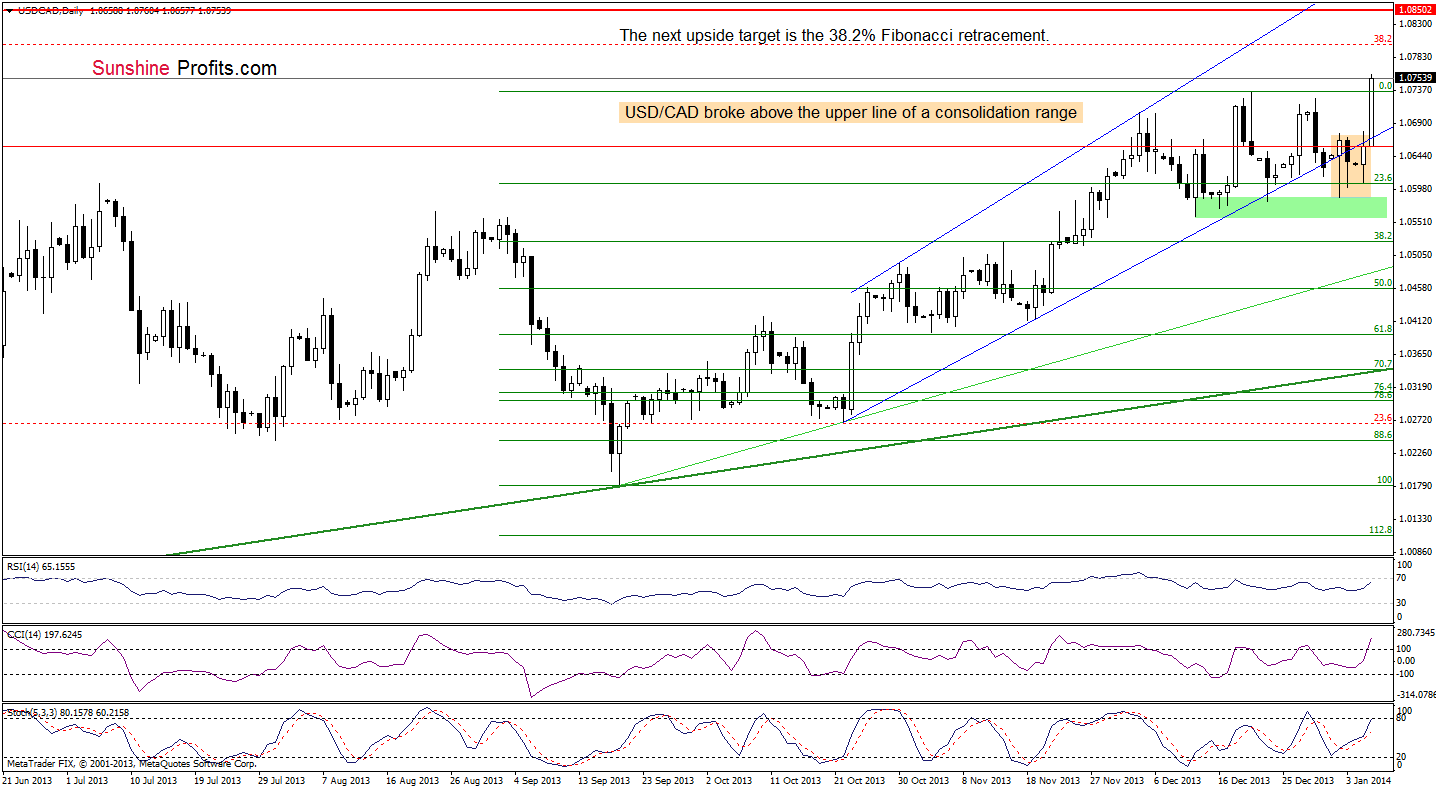
(…) if USD/CAD moves higher (above 1.068), we will likely see an upward move to the Dec. 30 high (or even to the 2013 peak). This scenario is reinforced by the position of the indicators – the Stochastic Oscillator generated a buy signal and the RSI is not overbought and still has space for further growth.
Looking at the above chart, we see that we had such price action earlier today. USD/CAD extended its gains and not only broke above the Dec. 30 high, but also hit a new annual high. From this perspective, the situation is bullish and if the buyers do not fail, the next upside target will be the 38.2% Fibonacci retracement level (around 1.0802).
Very short-term outlook: bullish
Short-term outlook: bullish
MT outlook: bullish
LT outlook: bearish
Trading position (short-term): we do not suggest opening any trading positions at the moment. We will keep you informed should anything change, or should we see a confirmation/invalidation of the above.
USD/CHF
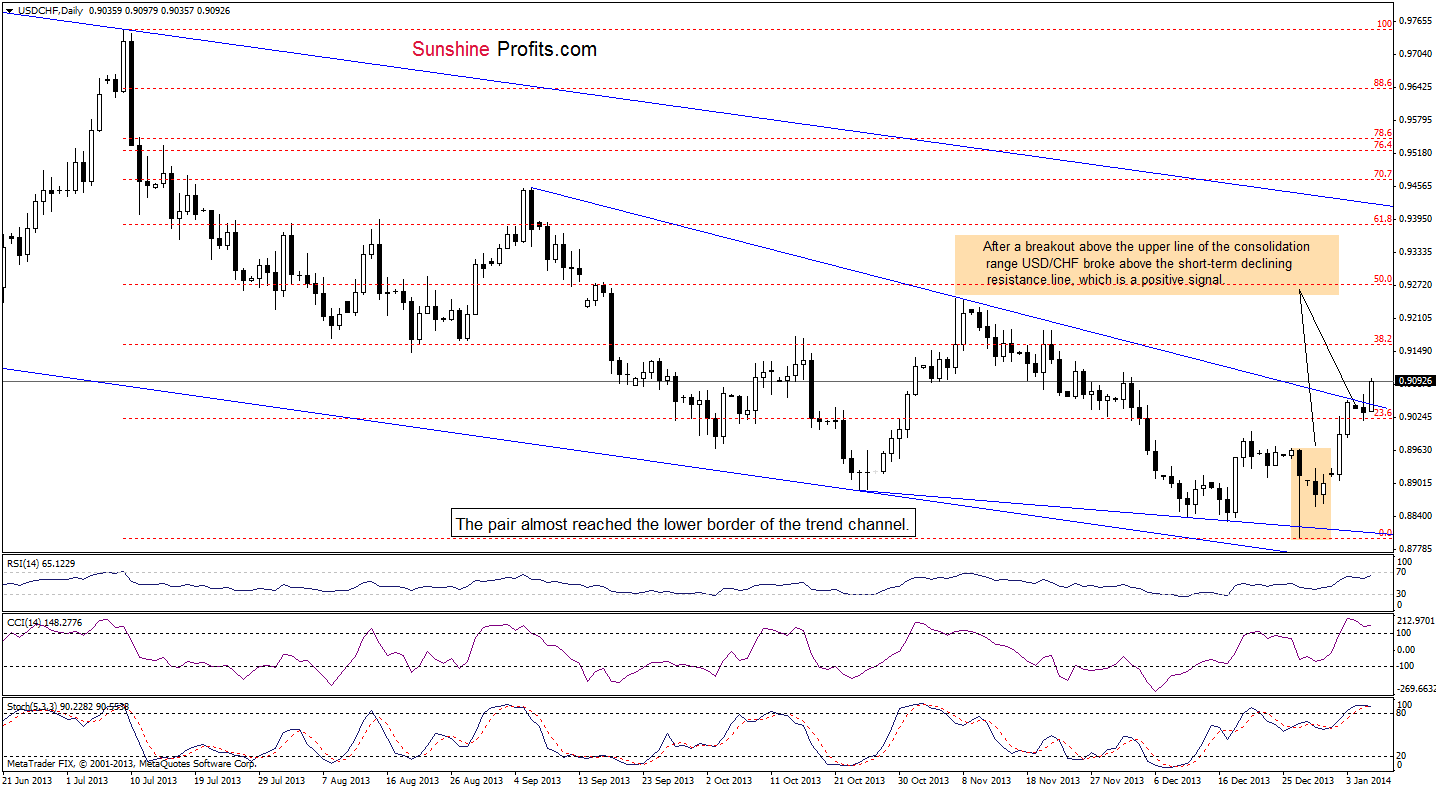
Looking at the above chart, we see that the situation has improved once again. After a breakout above the short-term declining resistance line based on the September and November highs, USD/CHF extended its gains and, as we wrote yesterday, the nearest upside target for the buyers is the 38.2% Fibonacci retracement level based on the Jul. - Dec. decline.
Nevertheless, we should keep in mind that the RSI approached the level of 70 and both other indicators are overbought. Therefore, a pause or a pullback in the near future should not surprise us.
Very short-term outlook: mixed with bullish bias
Short-term outlook: bearish
MT outlook: bearish
LT outlook: bearish
Trading position (short-term): we do not suggest opening any trading positions at the moment. We will keep you informed should anything change, or should we see a confirmation/invalidation of the above.
Thank you.
Nadia Simmons
Forex & Oil Trading Strategist
Oil Investment Updates
Oil Trading Alerts
