

Forex Trading Alert originally sent to subscribers on May 19, 2015, 10:22 AM.
Earlier today, the U.S. Commerce Department reported that the number of building permits issued last month increased by 10.1%, beating analysts’ expectations for a 2.2% rise. On top of that, the report also showed that U.S. housing starts soared by 20.2% in the previous month, beating forecasts for an increase of 9.9%. Thanks to these bullish numbers EUR/USD broke below important support line. How low could the exchange rate go in the coming days?
In our opinion the following forex trading positions are justified - summary:
- EUR/USD: Short positions (stop-loss order at 1.1667)
- GBP/USD: Short positions (stop-loss order at 1.5913)
- USD/JPY: none
- USD/CAD: Long positions (stop-loss order at 1.1706)
- USD/CHF: none
- AUD/USD: Short positions (stop-loss order at 0.8194)
EUR/USD
On Friday, we wrote the following:
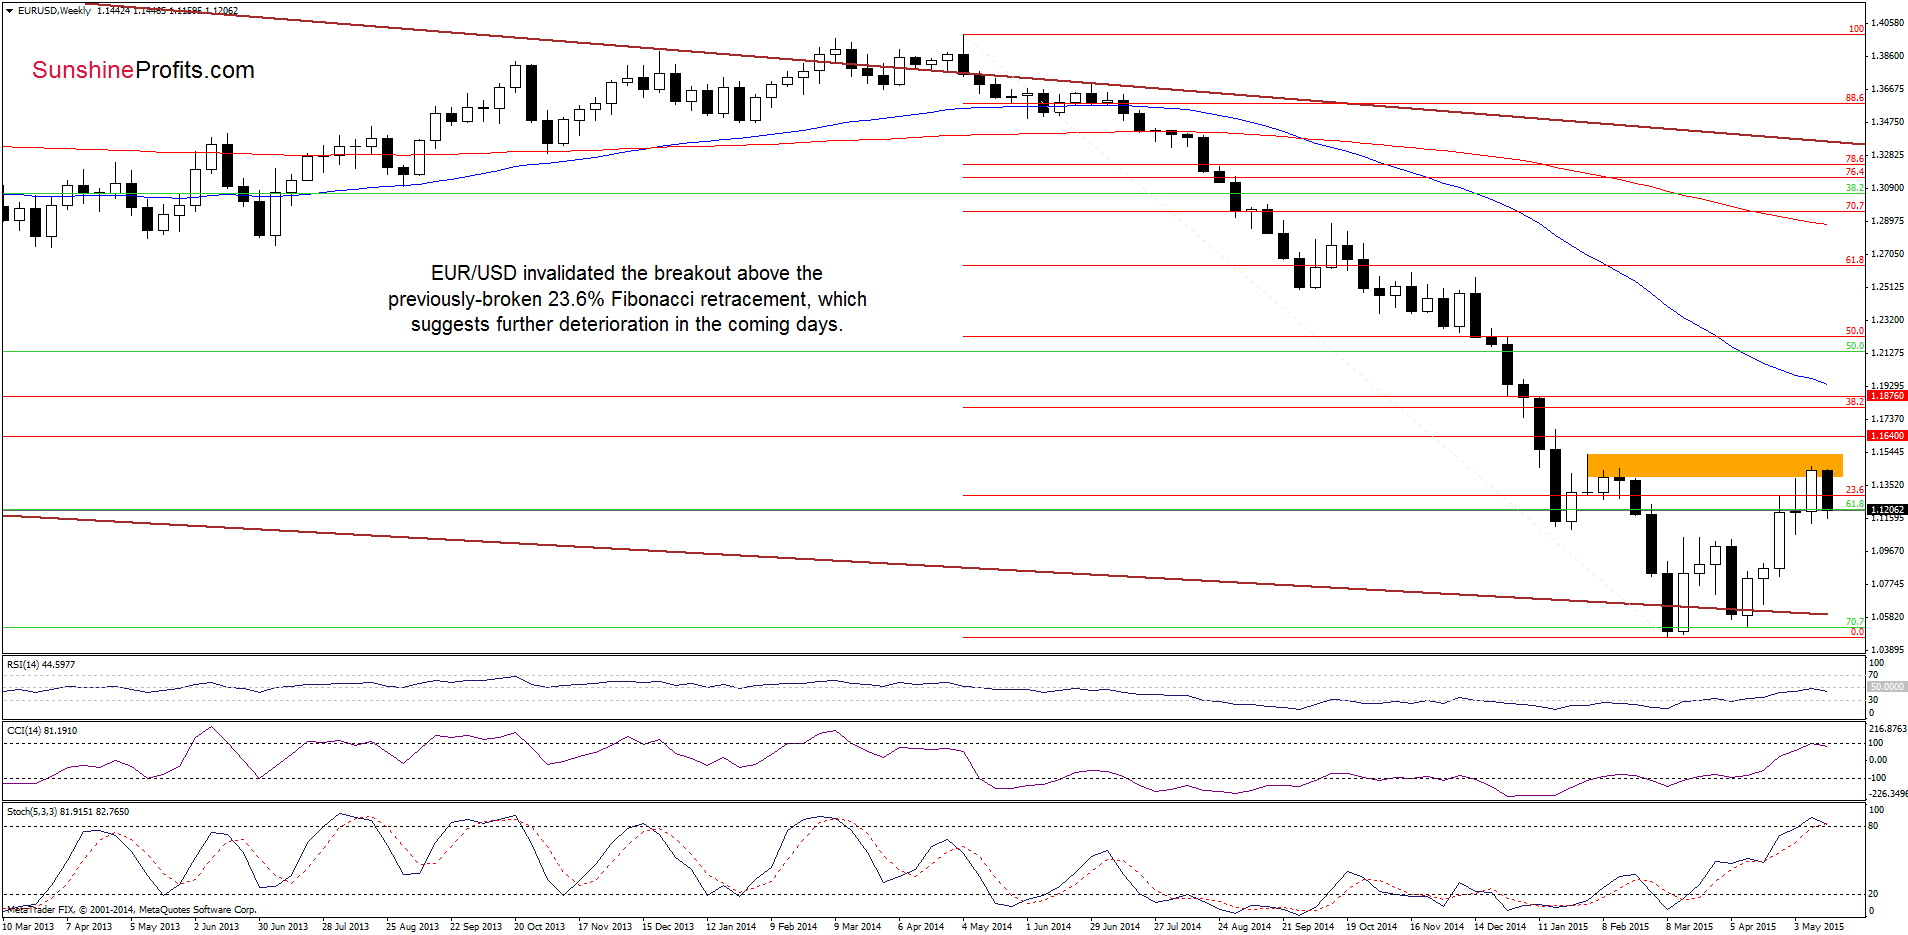
(…) the orange resistance zone could pause or even stop further improvement.
As you see on the weekly chart, the above-mentioned resistance encouraged currency bears to act, which resulted in an invalidation of the breakout above the previously-broken 23.6% Fibonacci retracement. This is a negative signal, which suggests further deterioration in the coming days.
How low could the exchange rate go? Let’s take a closer look at the daily chart and find out.
Quoting our last Forex Trading Alert:
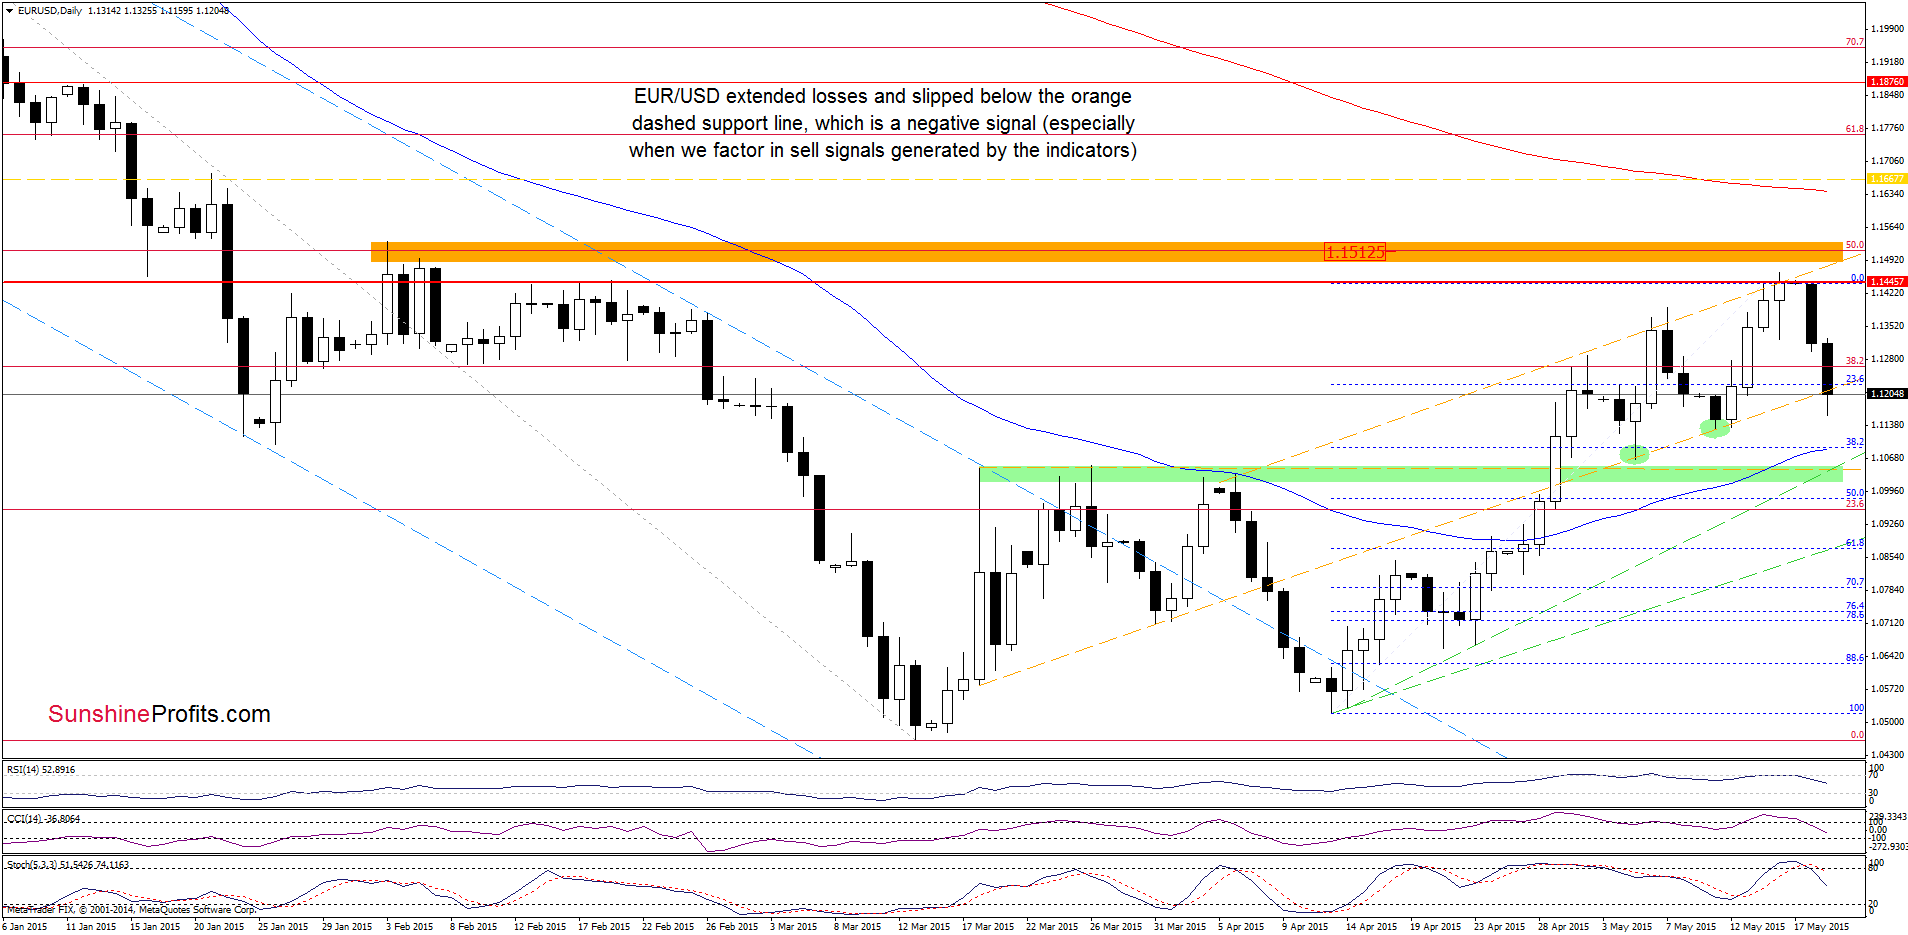
(…) the resistance area created by the mid-Feb highs and the dashed orange resistance line stopped further improvement, triggering a pullback earlier today. Taking this fact into account, and combining it with the proximity to the orange resistance zone (created by the 50% Fibonacci retracement and the Feb highs) and the current position of the indicators (they all generated sell signals), it seems that further deterioration is just around the corner. If this is the case, and the exchange rate moves lower form here, the initial downside target would be around 1.1184, where the dashed orange support line currently is.
Looking at the daily chart we see that the situation developed in line with the above-mentioned scenario and EUR/USD reached our downside target. In the previous weeks, this support line was strong enough to stop further deterioration and trigger upswings. Nevertheless, when we take a closer look at the daily chart we notice that currency bears managed to push the pair lower earlier today. In our opinion, if the exchange rate closes the day under this support line, it would be a negative signal, which will likely trigger further deterioration and a drop to around 1.1093, where the 38.2% Fibonacci retracement (based on the recent rally) and the 50-day moving average are. If this area is broken, the next target would be the green support zone (around 1.1014-1.1047).
Very short-term outlook: bearish
Short-term outlook: mixed with bearish bias
MT outlook: mixed
LT outlook: mixed
Trading position (short-term; our opinion): Short positions (which are already profitable) with a stop-loss order at 1.1667 are justified from the risk/reward perspective at the moment. We will keep you informed should anything change, or should we see a confirmation/invalidation of the above.
USD/JPY
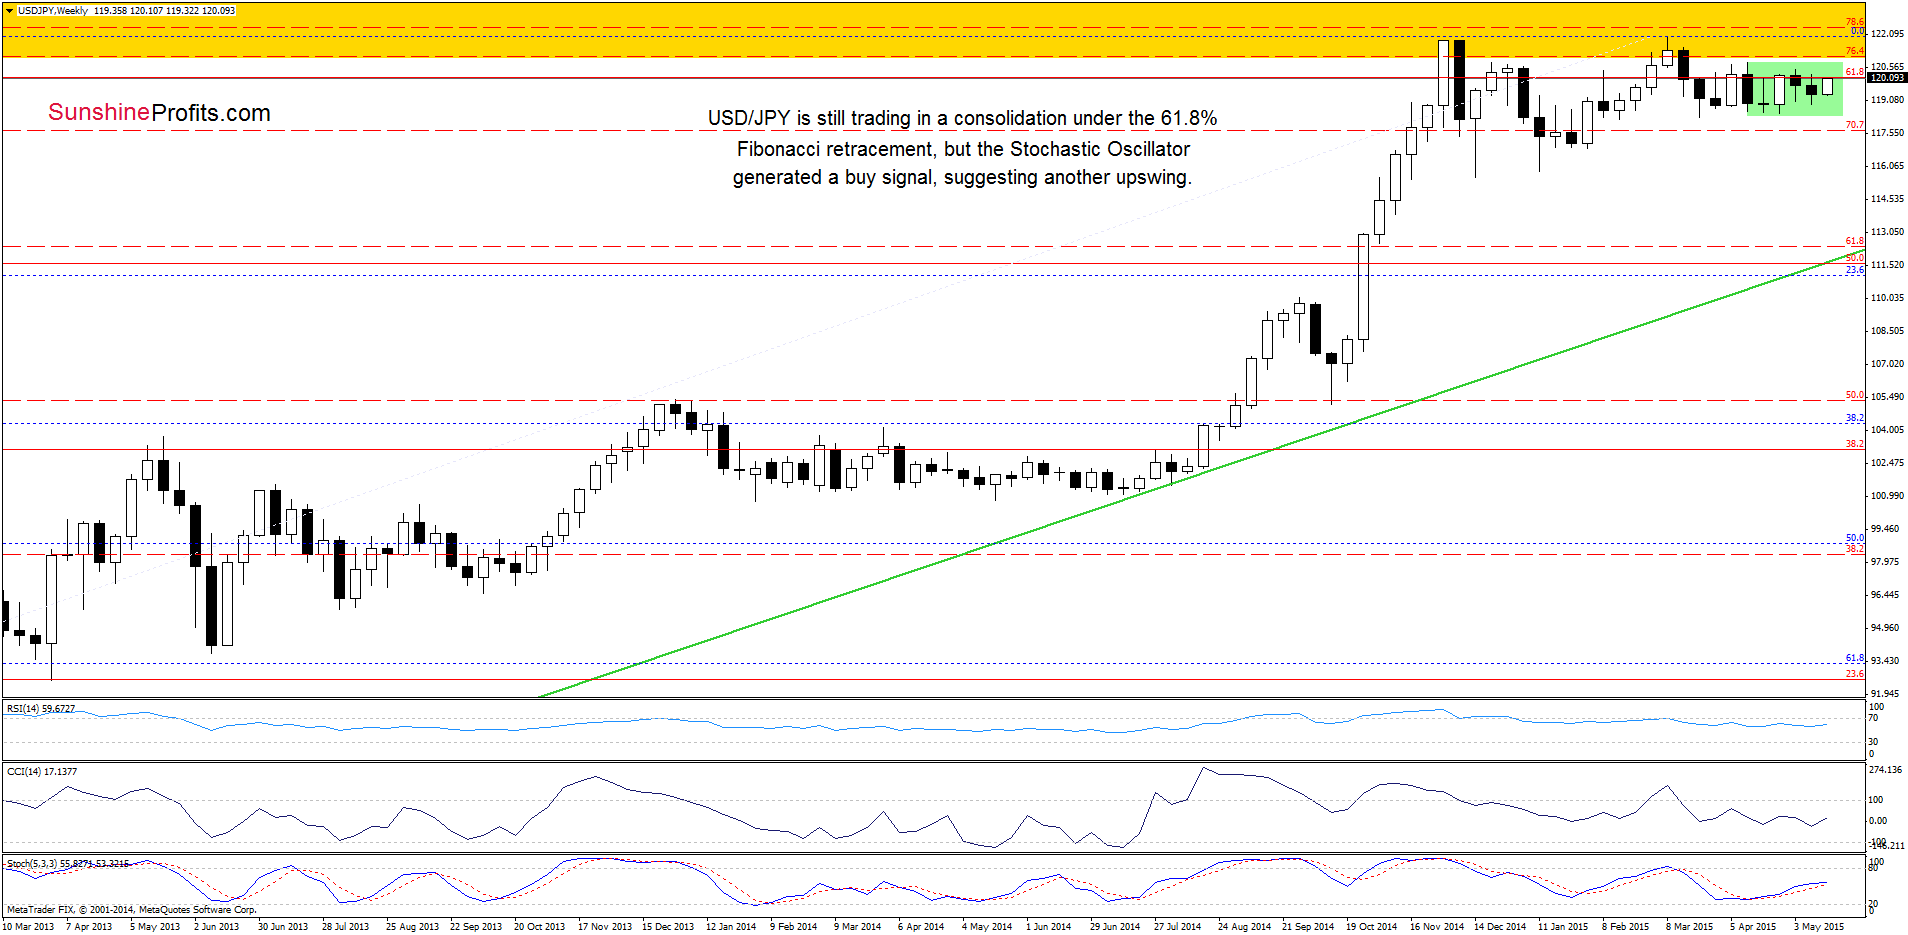
The medium-term picture hasn’t changed much as USD/JPY is trading in a consolidation around the 61.8% Fibonacci retracement level, which makes the outlook mixed. Nevertheless, a buy signal generated by the Stochastic Oscillator remains in place, suggesting another attempt to move higher.
Will we see further improvement in the coming days? Let’s focus on the very short-term chart and find out.
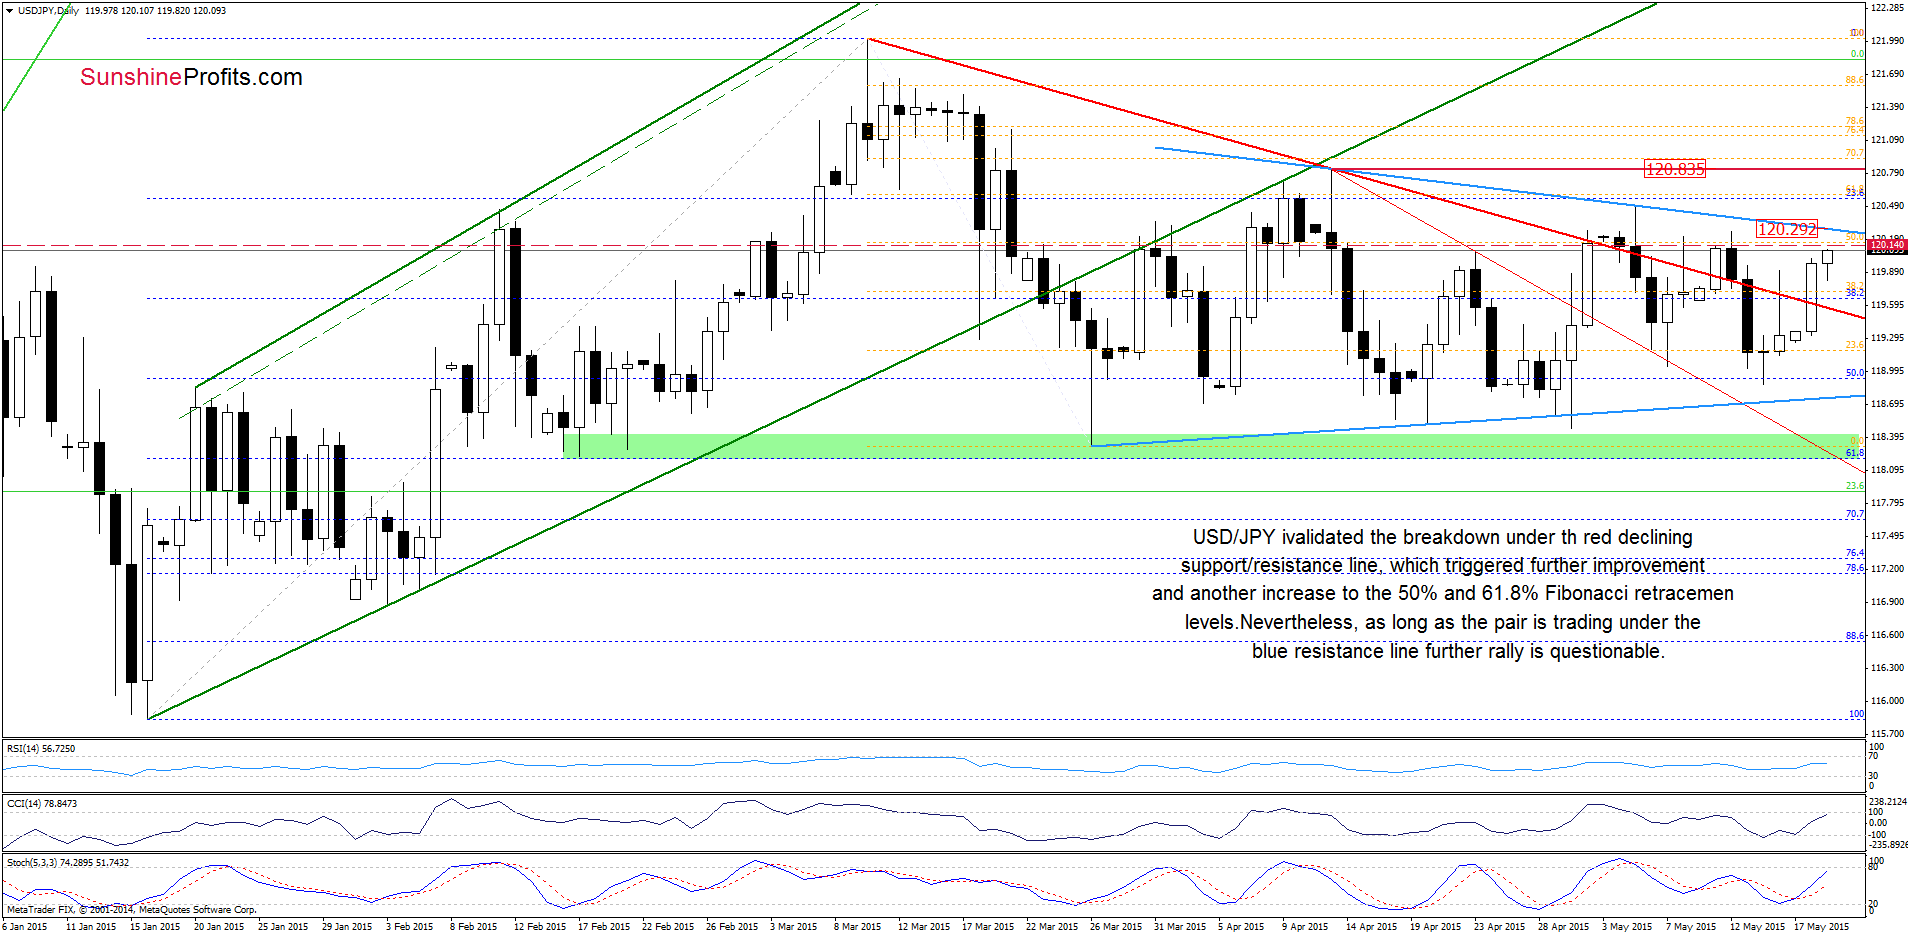
The first thing that catches the eye on the above chart is an invalidation of the breakdown under the previously-broken red declining support/resistance line. This positive signal triggered further improvement and another increase to the 61.8% Fibonacci retracement (in this area is also the 50% retracement based on the March declines). In the previous weeks, this resistance area has stopped currency bulls, triggering pullbacks, which suggests that we could see similar price action in the coming day(s). Nevertheless, buy signals generated by the daily indicators support further improvement. If this is the case, and the exchange rate moves higher from here, we’ll see a test of the strength of the blue resistance line (which is also the upper line of the triangle). If it is broken, the next target would be around 120.83, where the Apr 13 high is.
Very short-term outlook: mixed with bullish bias
Short-term outlook: mixed
MT outlook: mixed
LT outlook: bullish
Trading position (short-term; our opinion): No positions are justified from the risk/reward perspective at the moment. We will keep you informed should anything change, or should we see a confirmation/invalidation of the above.
USD/CAD
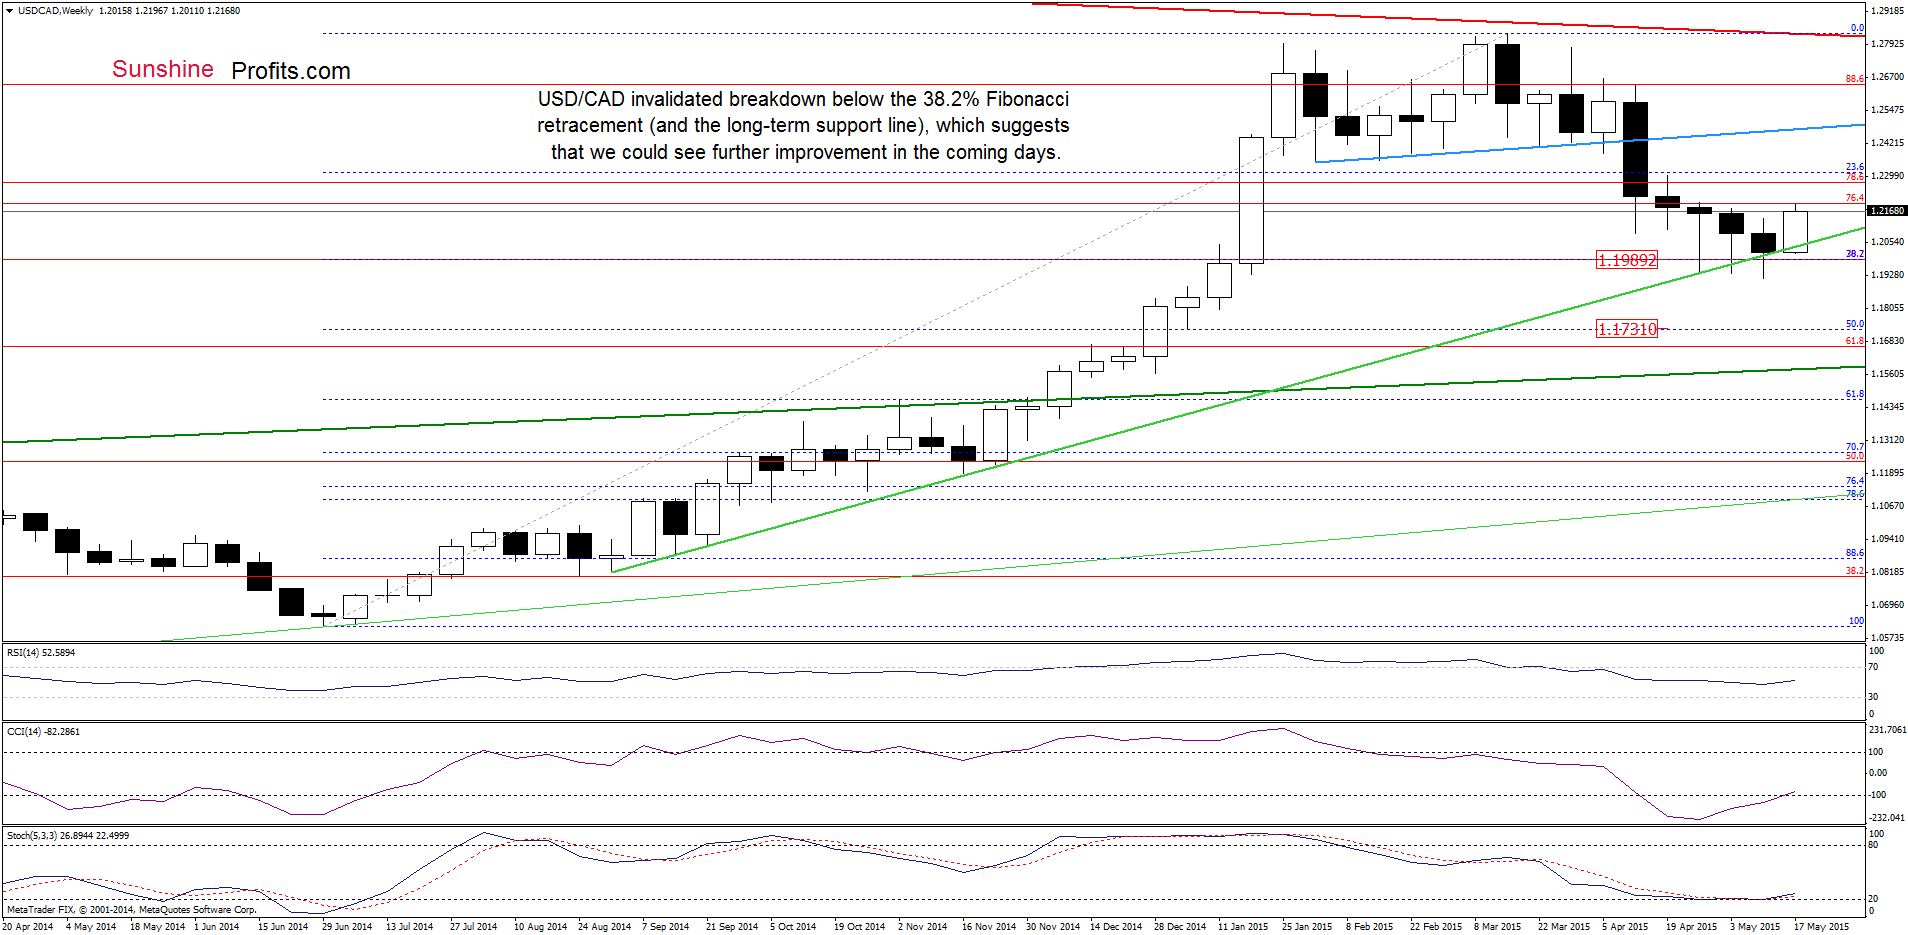
Looking at the weekly chart, we see that USD/CAD moved higher and invalidated (for the third time) the breakdown under the 38.2% Fibonacci retracement level and also below the long-term green line, which suggests higher values of the exchange rate in the coming week.
Are there any short-term factors that could support currency bulls? Let’s examine the daily chart and find out.
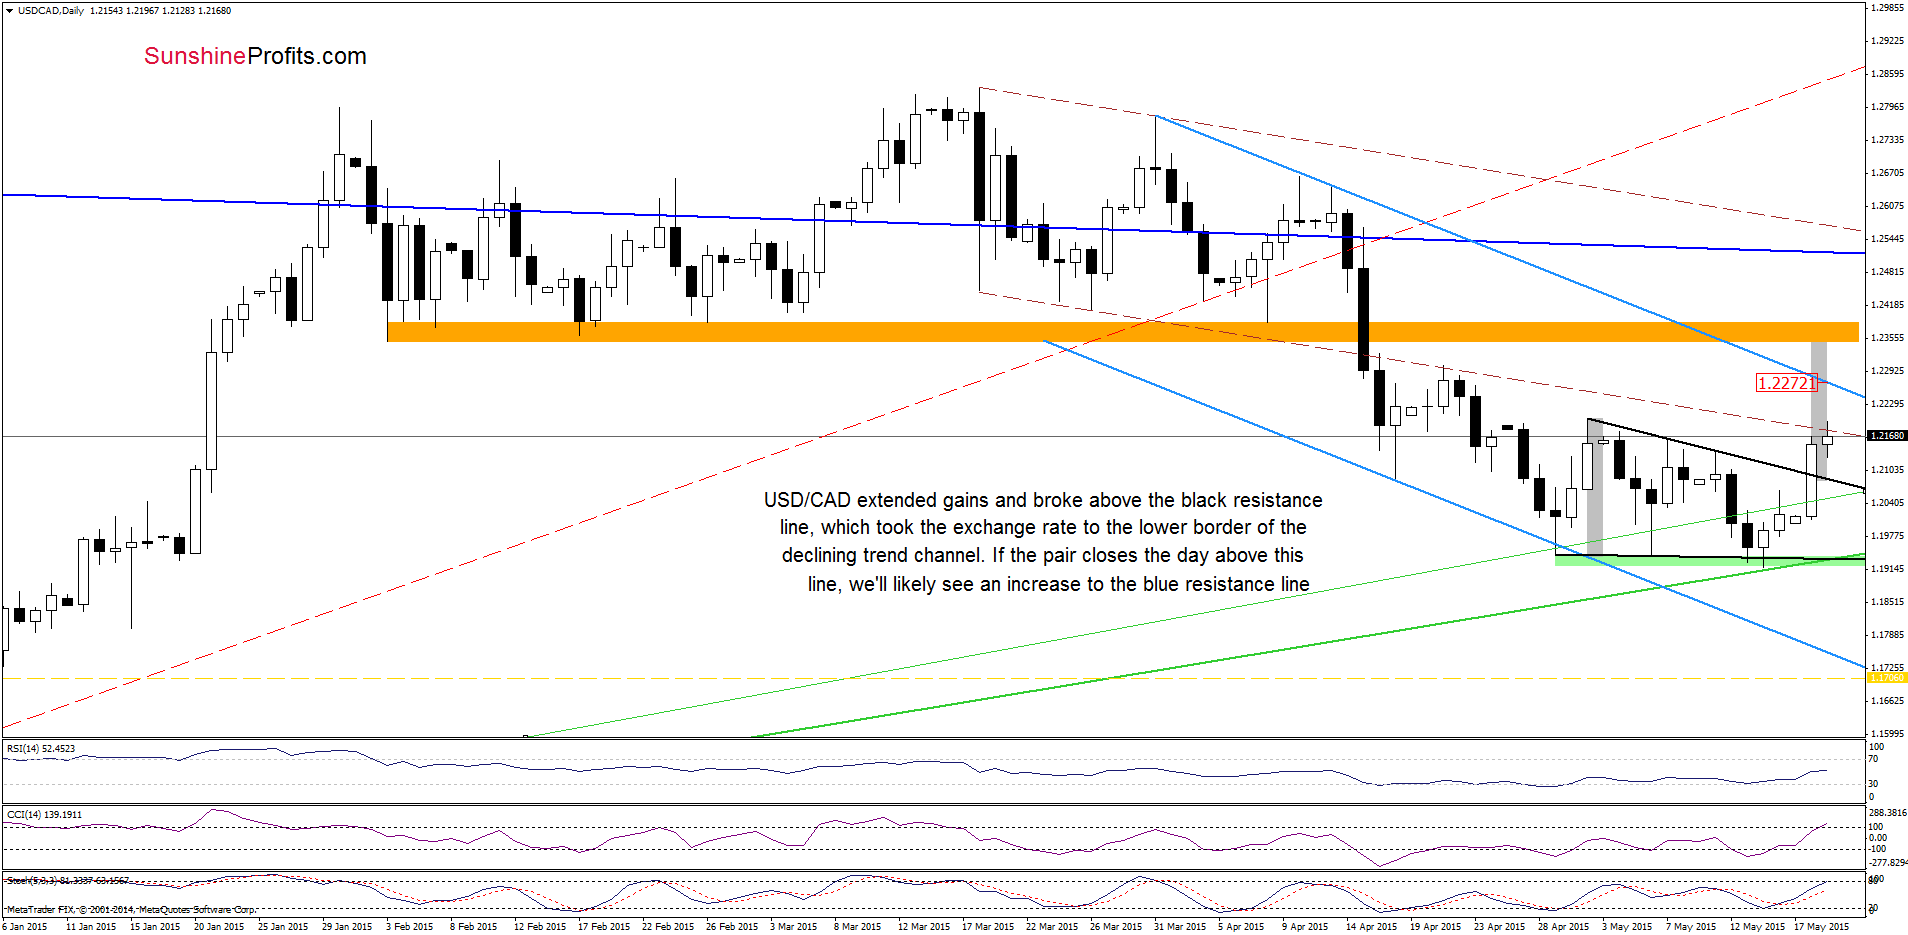
In our last commentary on this currency pair, we wrote the following:
(…) USD/CAD bounced off the long-term green support line and invalidated earlier breakdown below the previous lows, which is a bullish sign. Additionally, the RSI and CCI generated buy signals, while the Stochastic Oscillator is very close to doing the same, which supports further improvement. If this is the case, and the pair moved higher from here, the initial upside target would be the red resistance line (currently around 1.2034). If it is broken, we might see an upward move even to 1.2189, where the lower border of the declining trend channel currently is.
As you see on the daily chart, currency bulls pushed USD/CAD higher and reached our upside target earlier today. Although the lower border of the brown declining trend channel could trigger a small pullback from here, we think that the current position of the indicators (buy signals remain in place) in combination with the medium-term picture will trigger further improvement. At this point, it is worth noting that the recent upward move took the exchange rate above the black resistance line (the upper line of the triangle), which suggests a rally to the orange resistance zone in the coming days.
Very short-term outlook: bullish
Short-term outlook: mixed with bullish bias
MT outlook: mixed
LT outlook: mixed
Trading position (short-term; our opinion): Long positions (which are already profitable) with a stop-loss order at 1.1706 are justified from the risk/reward perspective at the moment. We will keep you informed should anything change, or should we see a confirmation/invalidation of the above.
Thank you.
Nadia Simmons
Forex & Oil Trading Strategist
Forex Trading Alerts
Oil Investment Updates
Oil Trading Alerts
