

Forex Trading Alert originally sent to subscribers on April 28, 2015, 9:44 AM.
Last week’s disappointing U.S. data on employment, home sales and industrial production weighed on investors’ sentiment, pushing back expectations on a first rate hike in June and making the greenback weaker. Thanks to these circumstances, AUD/USD extended gains and broke above important resistance levels. How high could the exchange rate go in the coming days?
In our opinion the following forex trading positions are justified - summary:
EUR/USD
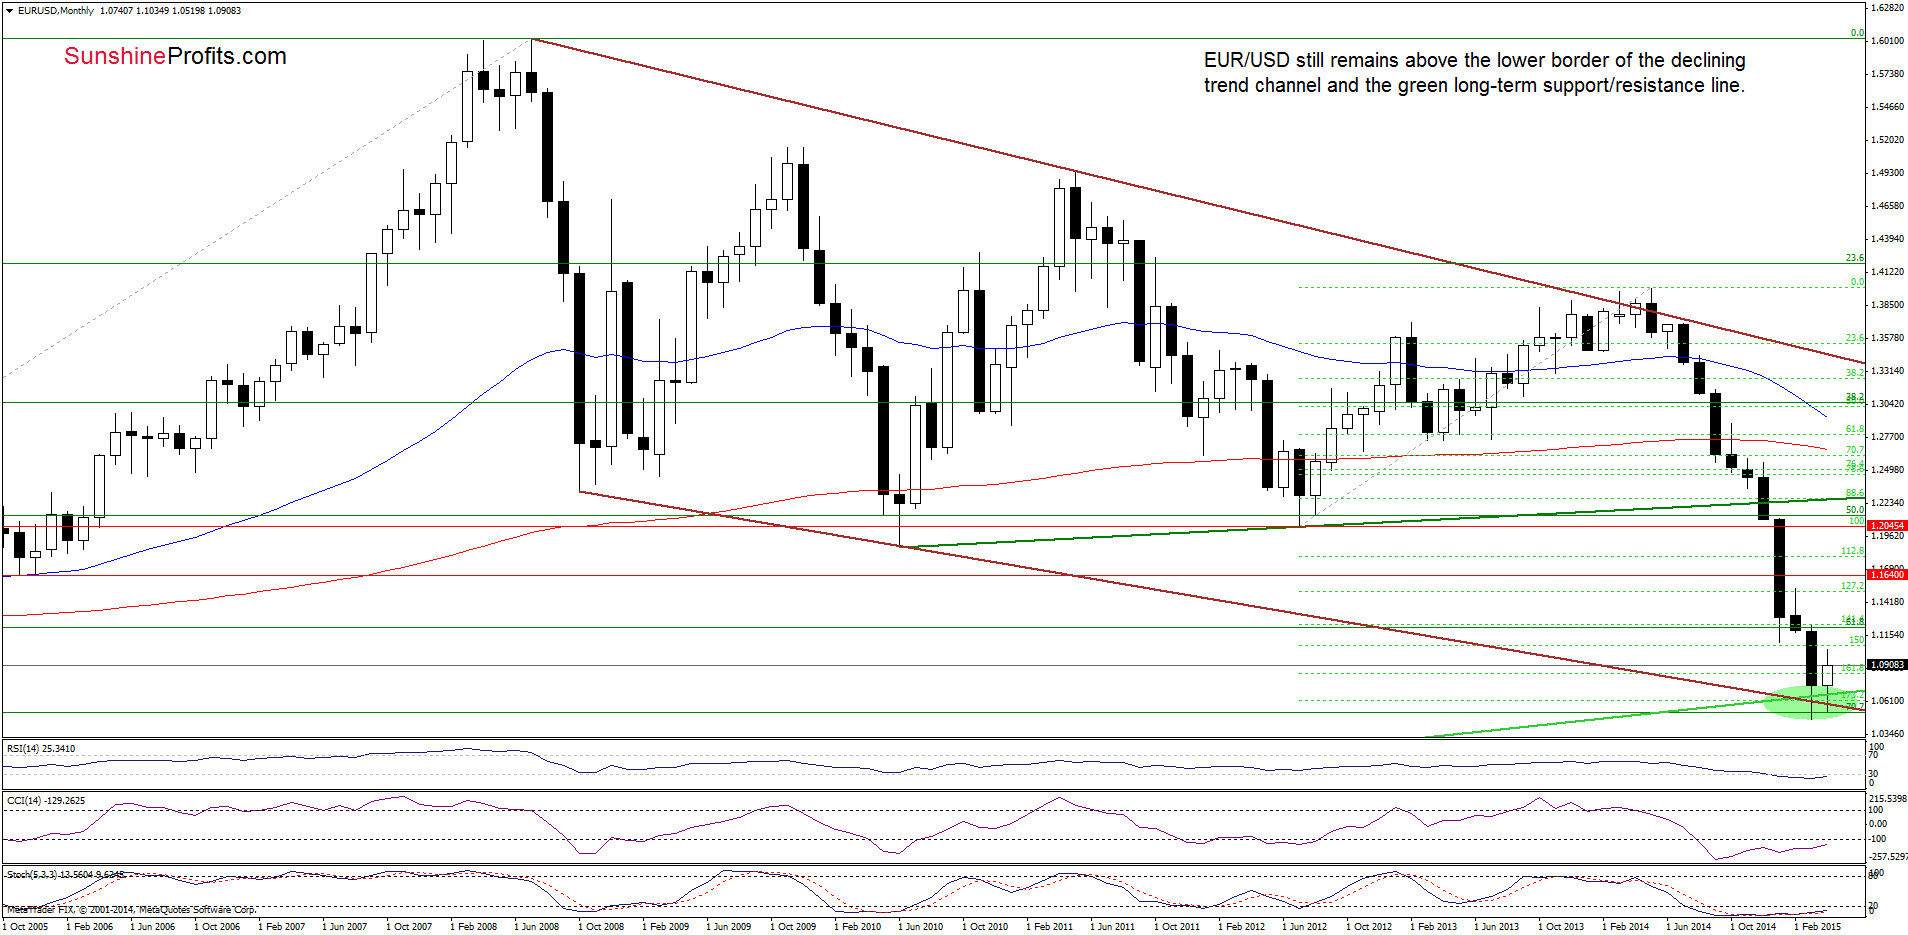
The situation in the medium term has improved slightly as EUR/USD extended gains and moved away from the long-term green support line and the lower border of the long-term declining trend channel.
Having said that, let’s take a closer look at the very short-term picture.
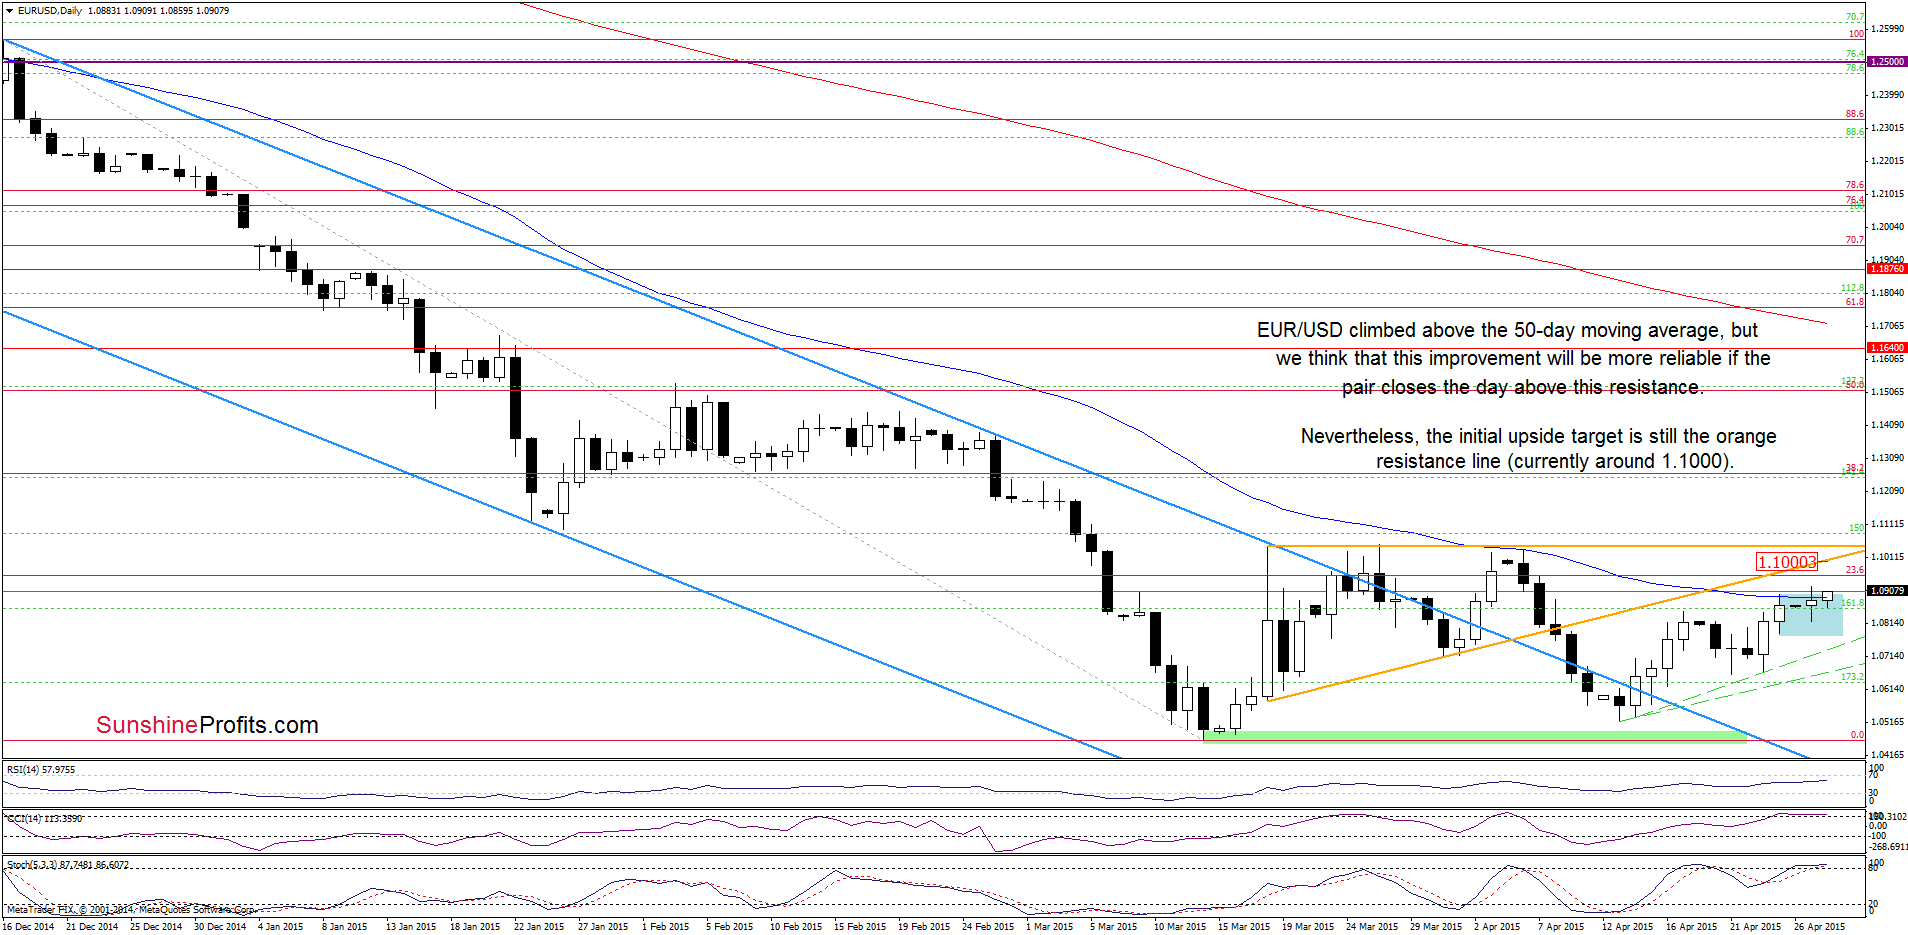
From this perspective, we see that EUR/USD climbed above the 50-day moving average. Although this is a positive signal, we think it would be more reliable if the pair closes the day above this resistance. If we see such price action, the initial upside target for currency bulls would be around 1.1000, where the orange resistance line is.
Before we move to the next currency pair please note that even if EUR/USD breaks above the above-mentioned line, the exchange rate will be still trading under the resistance zone created by the Mar and Apr highs. Therefore, in our opinion, a sizable upward move will be more likely only if we see a breakout above this area.
Very short-term outlook: mixed
Short-term outlook: mixed
MT outlook: mixed
LT outlook: mixed
Trading position (short-term; our opinion): No positions are justified from the risk/reward perspective at the moment. We will keep you informed should anything change, or should we see a confirmation/invalidation of the above.
USD/JPY
On Friday, we wrote the following:
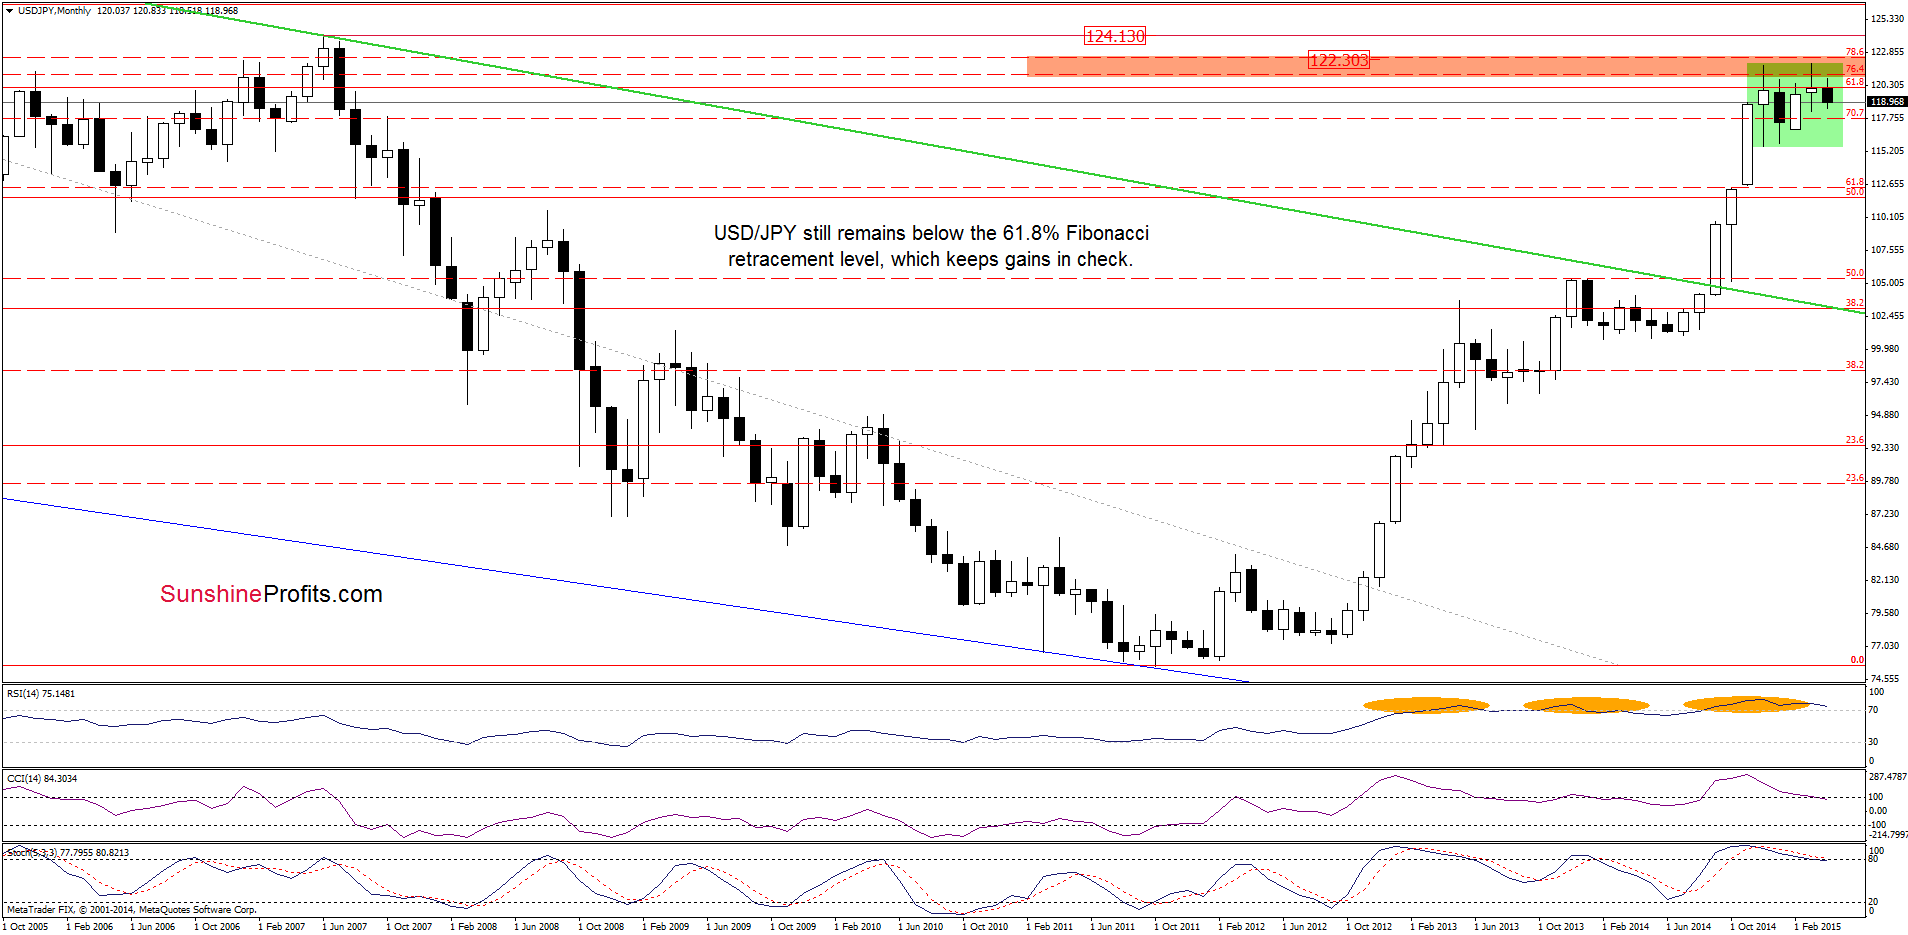
(…) the 61.8% Fibonacci retracement level (based on the entire 1998-2011 declines) stopped further improvement and triggered a sharp decline. Taking this fact into account, and combining it with a sell signal generated by the Stochastic Oscillator, it seems that we could see another drop to the green support zone (…) in the coming week.
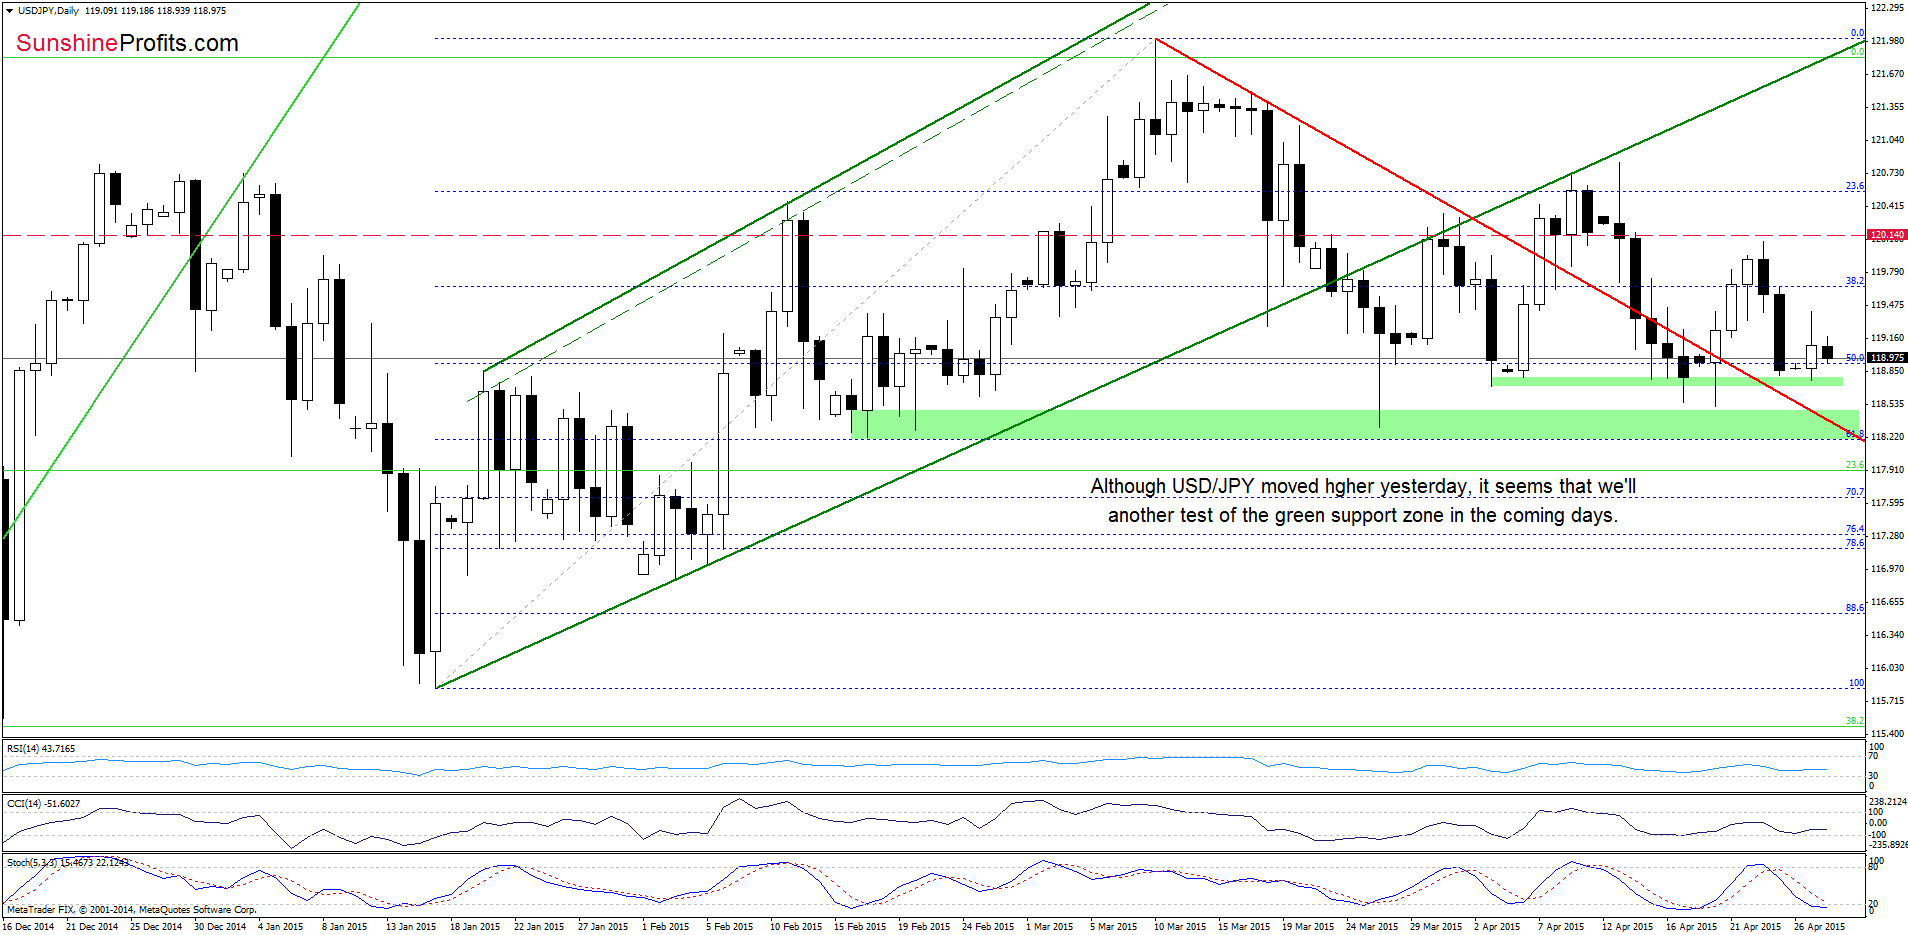
Yesterday, currency bears pushed the exchange rate to our downside target. As you see on the daily chart, this solid support area triggered a rebound, which erased 50% of the last week’s decline. Despite this improvement, the pair reversed earlier today, which suggests another test of the green zone. At this point, it is worth noting that sell signal generated by the Stochastic Oscillator remains in place, supporting the bearish case. Therefore, it seems that we could see a drop even to the red support line (which currently intersects the lower green support zone created by the mid-Feb and March lows) in the coming week.
Very short-term outlook: mixed with bearish bias
Short-term outlook: mixed
MT outlook: mixed
LT outlook: bullish
Trading position (short-term; our opinion): No positions are justified from the risk/reward perspective at the moment. We will keep you informed should anything change, or should we see a confirmation/invalidation of the above.
AUD/USD
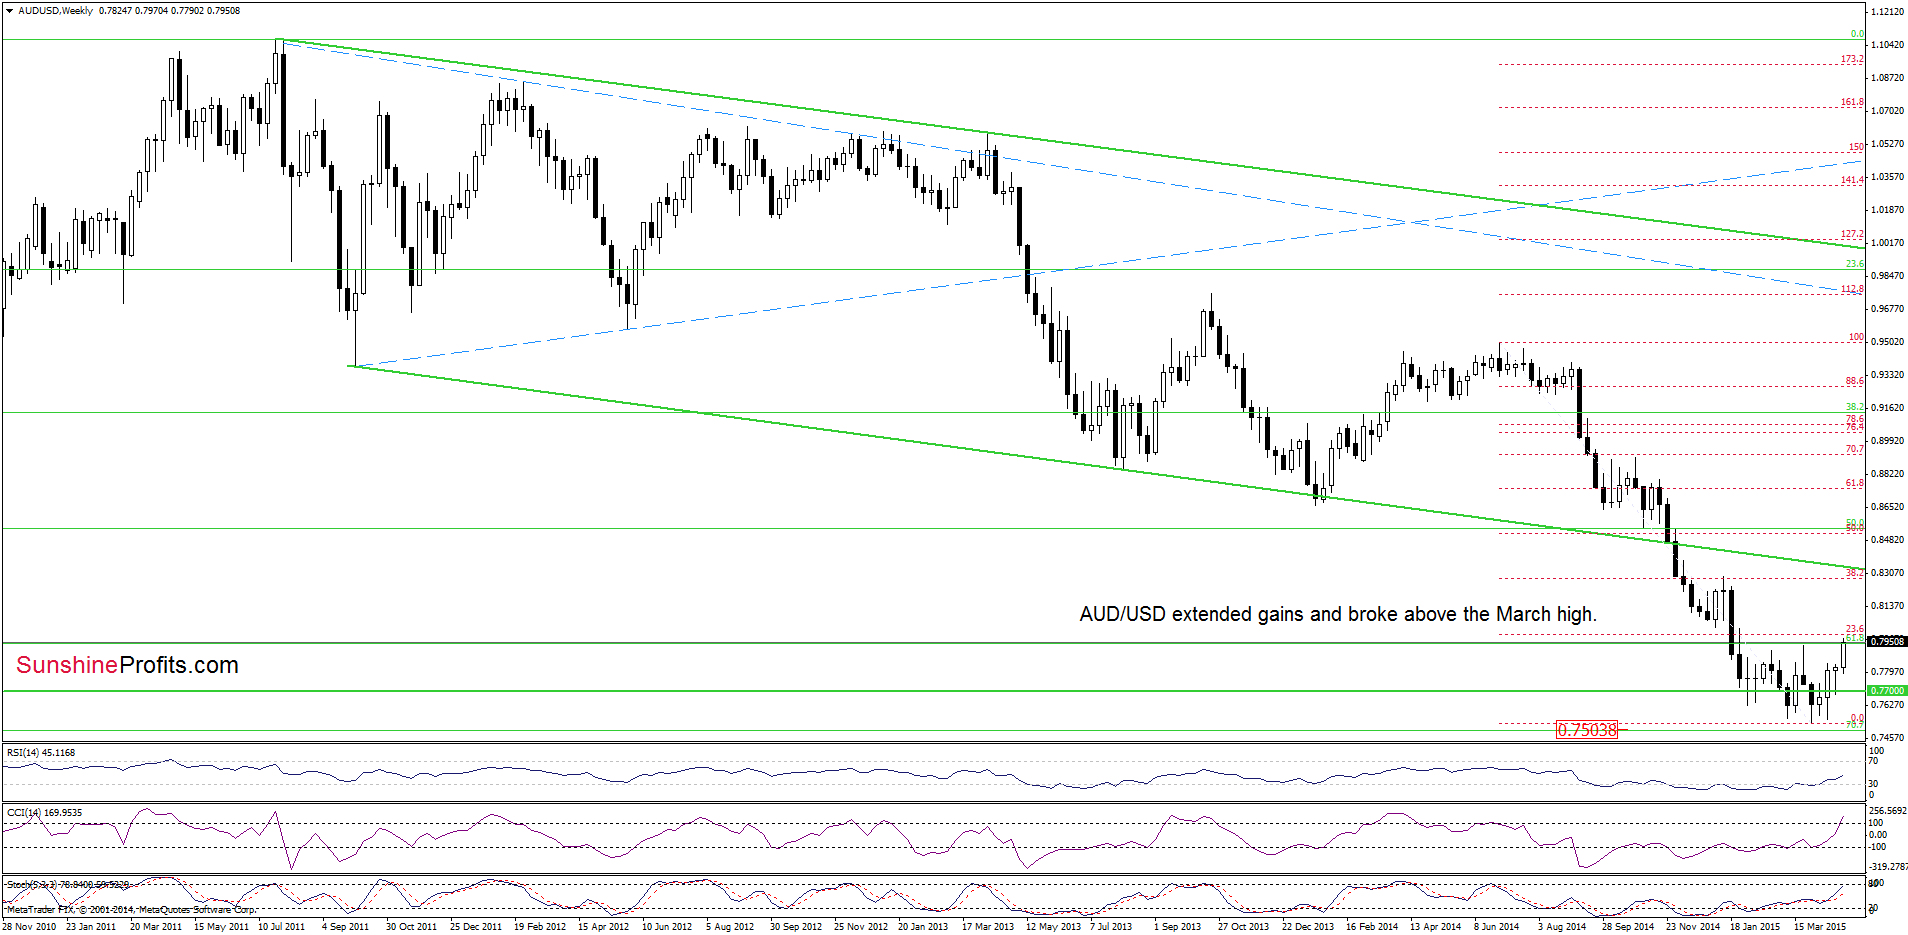
Looking at the above chart, we see that the medium-term picture has improved as AUD/USD extended gains and broke above the March high. This is a positive sign, which suggests that if the pair climbs above the 23.6% Fibonacci retracement (based on the entire June-March declines) around 0.8000, we might see a rally even to around 0.8284, where the next Fibonacci retracement and the Jan high are.
How did this move affect the very short-term chart? Let’s take a look.
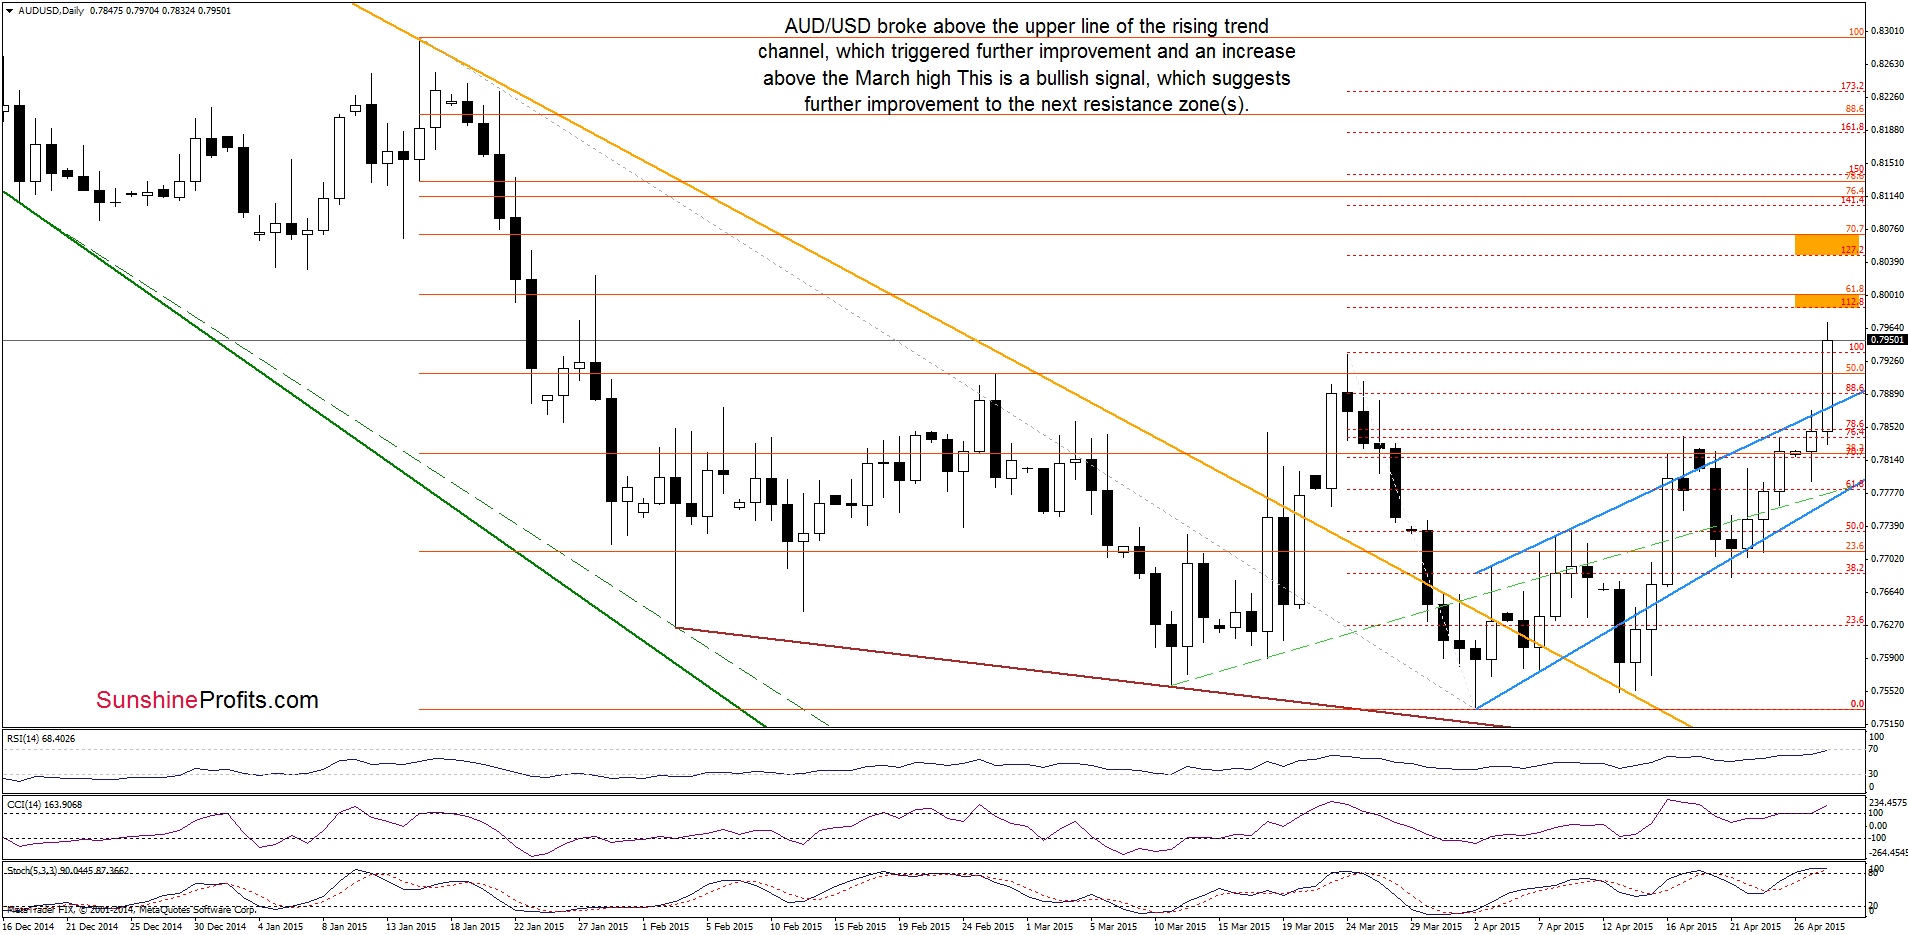
As you see on the above chart, AUD/USD broke above the upper line of the rising trend channel, which triggered a sharp rally and a comeback above the March high. This is a bullish signal, which suggests further improvement. If this is the case, and the pair moves higher from here, the initial upside target would be around 0.7990-0.8000, where the first orange resistance zone (created by the 61.8% Fibonacci retracement and the 112.8% Fibonacci extension) is. As we have pointed out before, in this area is also the 23.6% Fibonacci retracement (based on the entire June-March declines), which could pause (or even stop) further rally. Why? The daily CCI and Stochastic Oscillator are overbought, while the RSI almost reached the level of 70, which suggests that a reversal is just around the corner.
Very short-term outlook: mixed
Short-term outlook: mixed
MT outlook: mixed
LT outlook: mixed
Trading position (short-term; our opinion): No positions are justified from the risk/reward perspective at the moment. We will keep you informed should anything change, or should we see a confirmation/invalidation of the above.
Thank you.
Nadia Simmons
Forex & Oil Trading Strategist
Przemyslaw Radomski, CFA
Founder, Editor-in-chief
Gold & Silver Trading Alerts
Forex Trading Alerts
Oil Investment Updates
Oil Trading Alerts
