

Forex Trading Alert originally sent to subscribers on April 16, 2015, 10:39 AM.
Yesterday, the Bank of Canada left its monetary policy unchanged (the overnight cash rate at 0.75%), which in combination with a sharp increase in crude oil pushed the Canadian dollar higher against its U.S. counterpart. As a result, USD/CAD broke below important support levels, confirming a bearish formation. How low could the exchange rate go?
In our opinion the following forex trading positions are justified - summary:
- EUR/USD: none
- GBP/USD: none
- USD/JPY: none
- USD/CAD: short (stop loss order at 1.2876)
- USD/CHF: none
- AUD/USD: none
EUR/USD
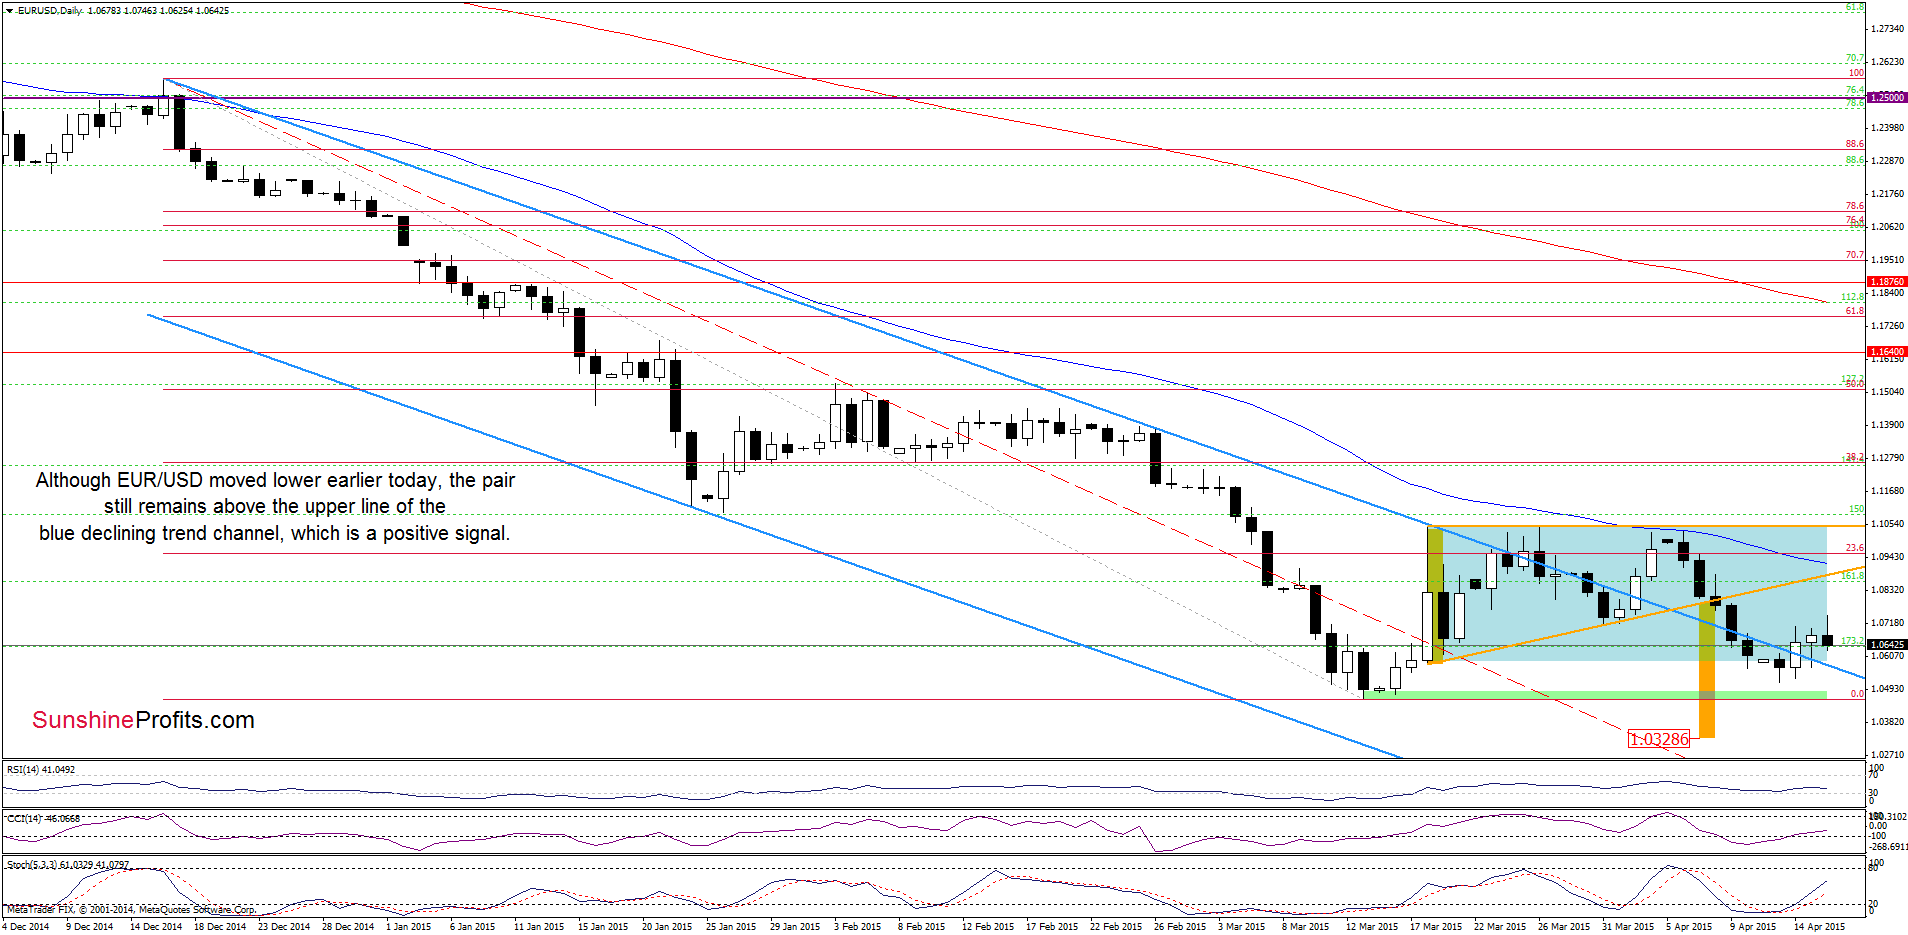
The medium-term picture hasn’t changed much as EUR/USD is still trading in a narrow range between the lower border of the declining trend channel and the long-term resistance line, which means that as long as there is no breakout/breakdown, a sizable upward/downward move is not likely to be seen.
Will the daily chart give us clues about future moves? Let’s check.
Quoting our previous Forex Trading Alert:
(…) the pair invalidated the breakdown under the upper border of the blue declining trend channel and the lower line of the consolidation, which is a positive sign. Additionally, buy signals generated by the indicators remain in place, supporting further improvement.
Yesterday, EUR/USD moved lower and verified the above-mentioned breakout, which was a positive sign that triggered a rebound. Although the pair moved lower earlier today, the exchange rate is still trading above the upper border of the blue declining trend channel (and buy signals remain in place), which suggests another attempt to move higher in the coming days (even if EUR/USD tests its nearest support once again). If this is the case, the initial upside target from our last commentary will be in play:
(...) If (…) the exchange rate moves higher from here, the initial upside target would be the previously-broken orange resistance line (currently around 1.0854).
Very short-term outlook: mixed
Short-term outlook: mixed
MT outlook: mixed
LT outlook: mixed
Trading position (short-term; our opinion): No positions are justified from the risk/reward perspective at the moment. We will keep you informed should anything change, or should we see a confirmation/invalidation of the above.
USD/JPY
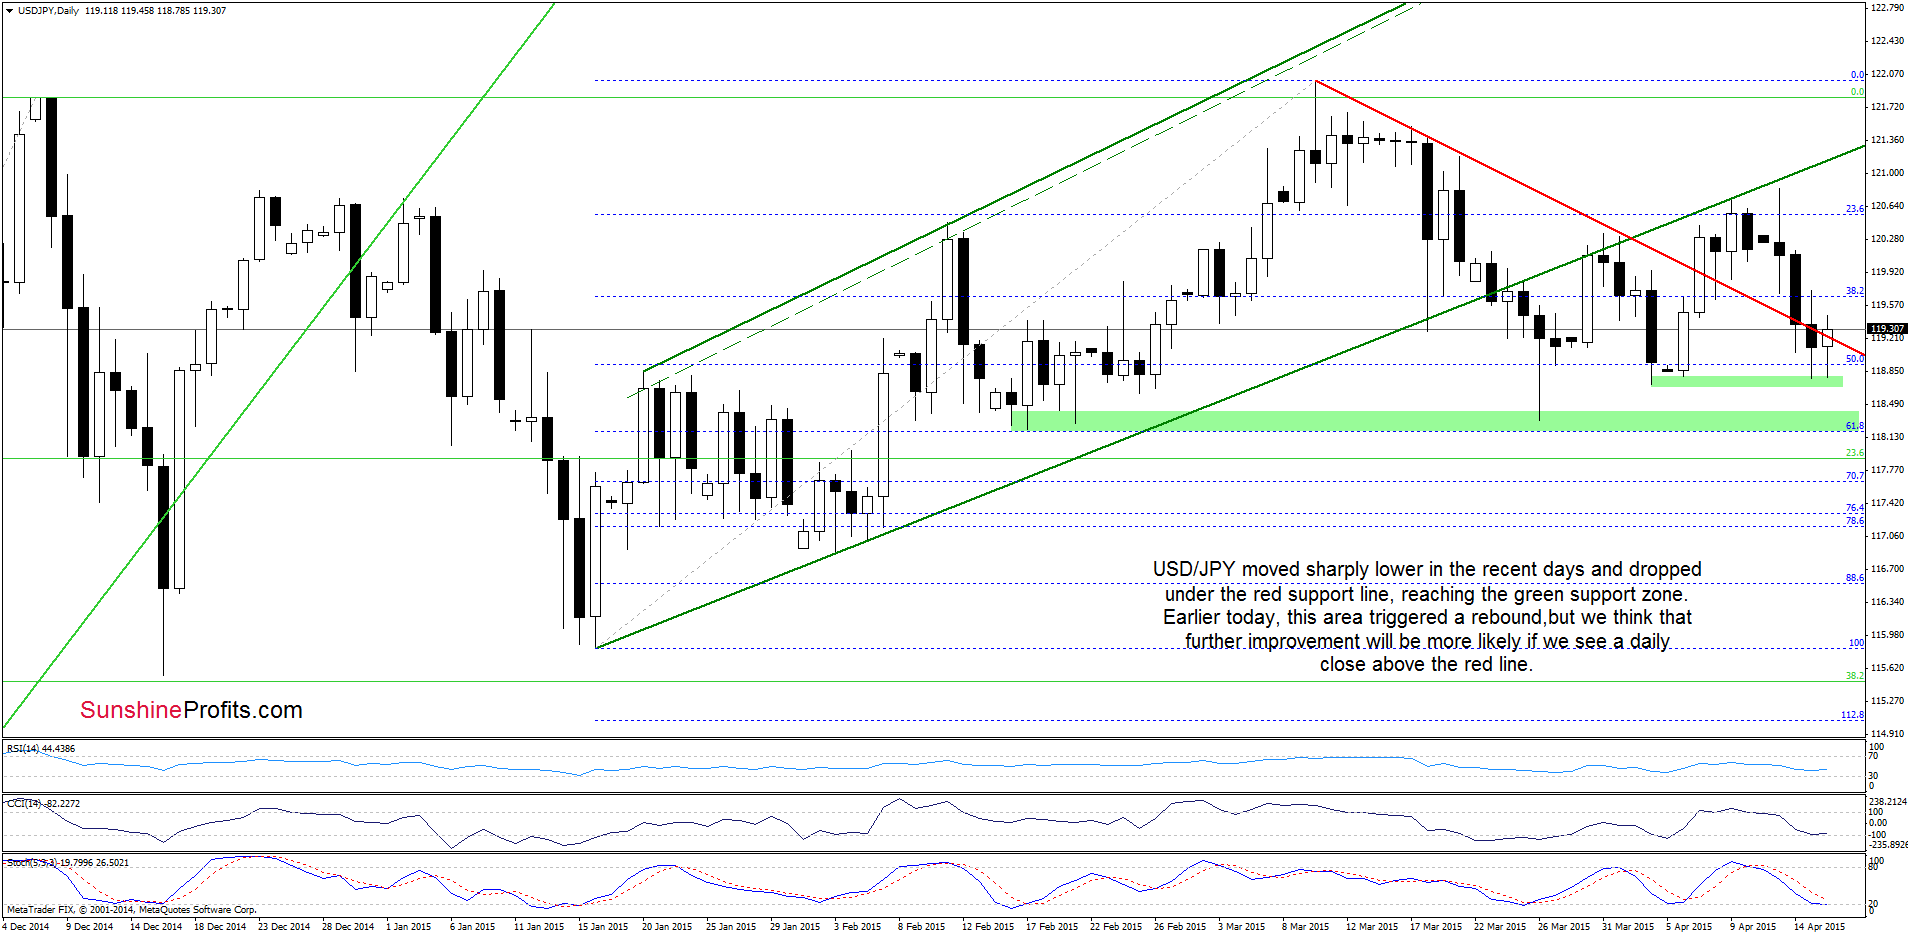
The medium-term outlook remains mixed as USD/JPY is still trading in a consolidation (between the Dec high and low) around the 61.8% Fibonacci retracement level (based on the entire 1998-2011 declines). Today, we’ll focus on the very short-term changes.
On Tuesday, we wrote the following:
(…) the green line is still in play and keeps gains in check. Taking this fact into account, and combining it with sell signals generated by the CCI and Stochastic Oscillator, we think that further deterioration is just around the corner. If this is the case, and USD/JPY moves lower from here, the initial downside target would be the previously-broken red declining support line (currently around 119.36). If it is broken, we might see a decline even to 118.71-118.85, where the bottom of the previous pullback is.
Looking at the daily chart, we see that the situation developed in line with above scenario and USD/JPY reached our downside target. Earlier today, the green support zone triggered a rebound, which took the exchange rate above the declining red line. Despite this improvement, sell signals generated by the indicators remain in place, supporting the bearish case. Therefore, in our opinion, today’s increase will be more reliable if we see a daily close above the resistance line.
Very short-term outlook: mixed
Short-term outlook: mixed
MT outlook: mixed
LT outlook: bullish
Trading position (short-term; our opinion): No positions are justified from the risk/reward perspective at the moment. We will keep you informed should anything change, or should we see a confirmation/invalidation of the above.
USD/CAD
In our yesterday’s commentary we wrote:
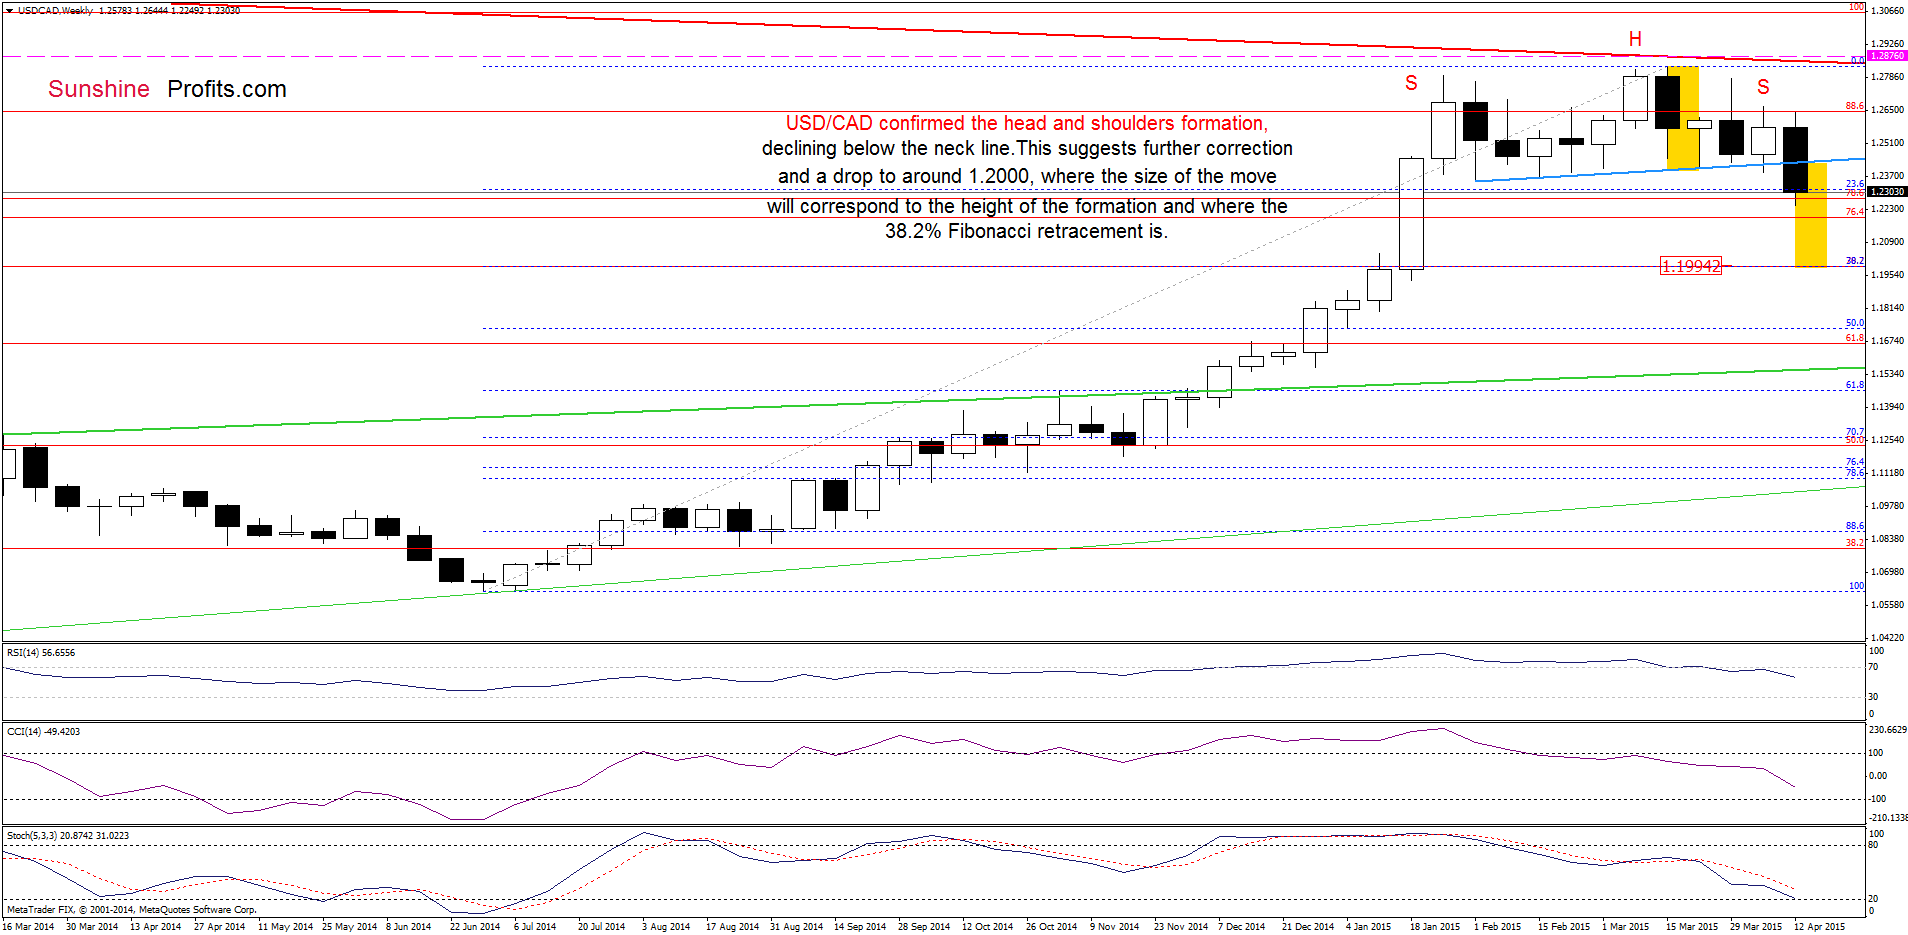
(…) when we take a closer look at the chart we can see a potential head and shoulders formation. Therefore, if USD/CAD declines below the neck line (the blue support line around 1.2428), it would be a bearish signal, which will likely trigger further deterioration.
As you see on the weekly chart, USD/CAD moved sharply lower and broke below the neck line, which suggests further correction and a drop to around 1.2000, where the size of the downward move will correspond to the height of the formation and where the 38.2% Fibonacci retracement level is.
Are there any short-term support levels that could hinder the realization of the above scenario? Let’s examine the daily chart and find out.
Quoting our last Forex Trading Alert:
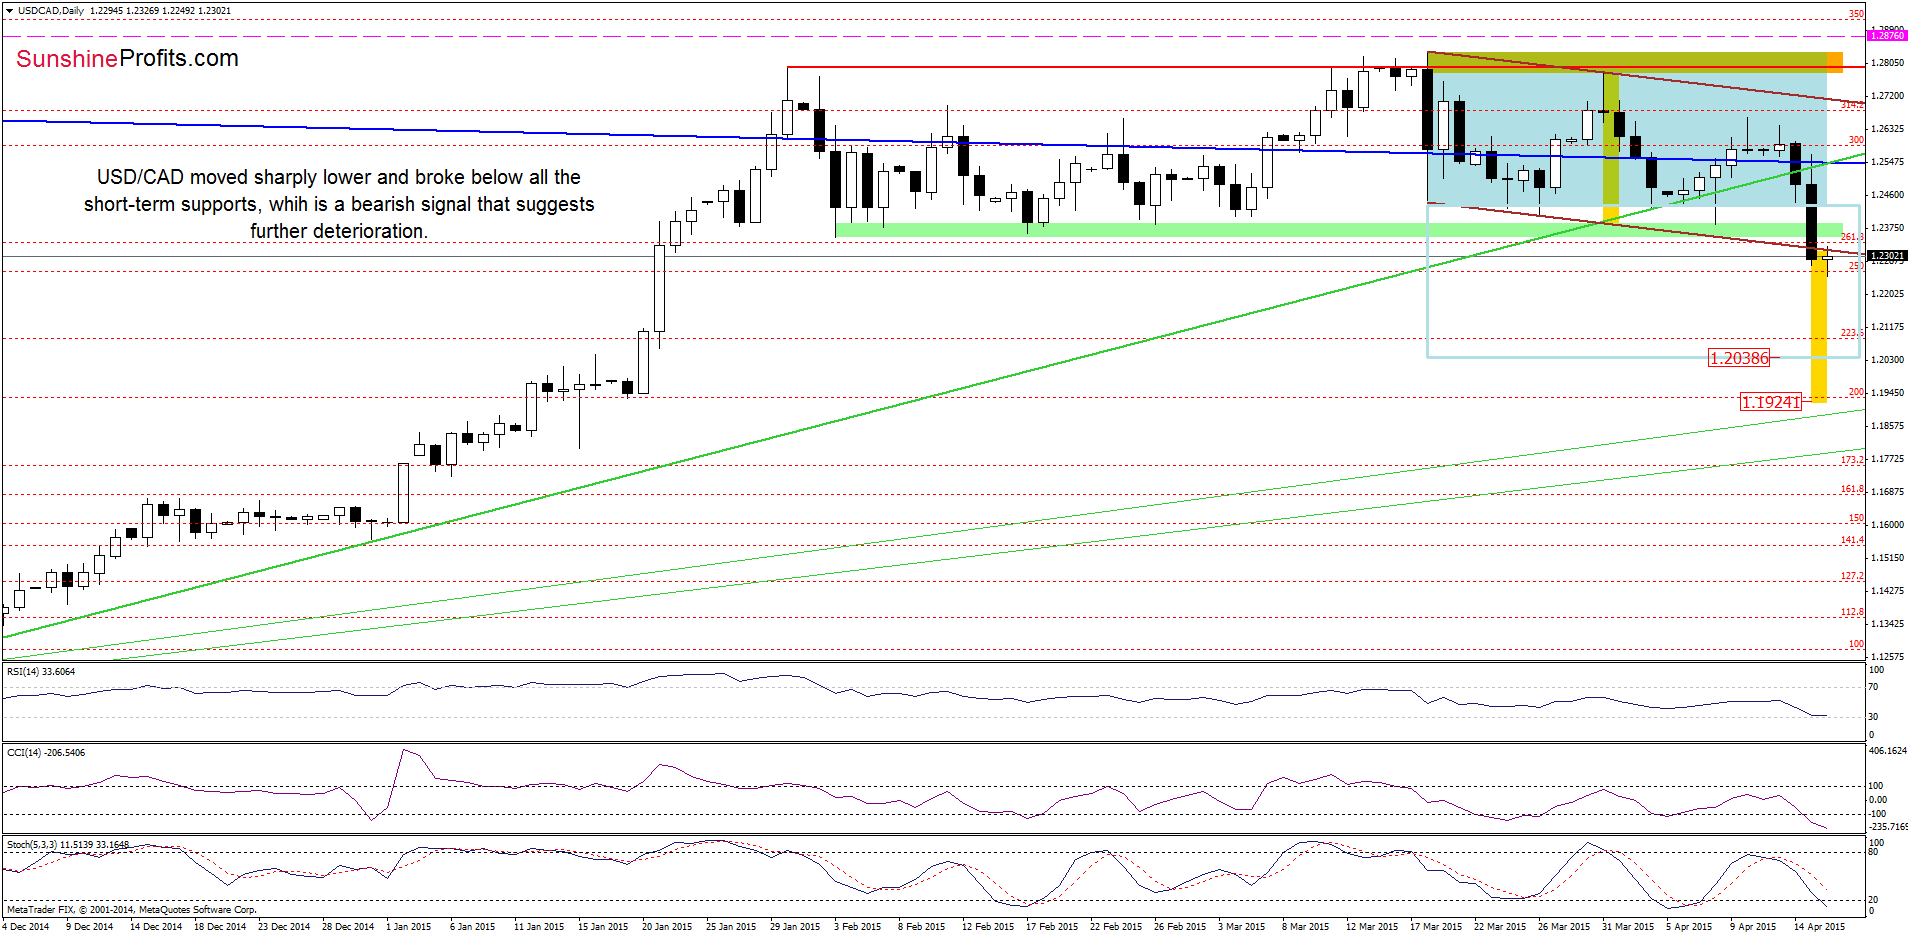
(…) the exchange reversed and declined not only below the blue line, but also under the green support line, which suggests further deterioration and another test of the green support zone or even a drop to the lower border of the declining trend channel (currently around 1.2326) in the coming day(s). Please note that this scenario is also reinforced by the sell signal generated by the Stochastic Oscillator at the moment.
On the above chart we see that currency bears pushed USD/CAD lower as we expected. With this downswing the exchange rate broke not only below the green support zone, but also under the lower border of the declining trend channel. Taking the above into account, and combining it with sell signals generated by the indicators and the medium-term picture, we think that further deterioration s more likely than not. Please note that the pair verified yesterday’s breakdown earlier today, which is an additional negative signal. Therefore, in our opinion, the initial downside target for currency bears would be around 1.2040, where the size of the downward move will correspond to the height of the consolidation (on Tuesday, the pair broke below the lower line of the formation, triggering a bearish scenario).
Before we summarize today’s alert we would like to draw your attention to the relationship between the exchange rate and the oil market. The reason? In January, the Bank of Canada surprised markets with an unexpected rate cut, which was “insurance” (in the words of the Governor Stephen Poloz) against the effects of lower oil prices. Meanwhile, since the beginning of the month, the commodity gained almost 18%, which was supportive for the Canadian dollar (in this period of time USD/CAD lost 3%). Therefore, we think that the pair’s further moves will continue to strongly linked to the price of crude oil (if you want to keep up with the changes taking place every day and receive trading signals, we encourage you to read our daily Oil Trading Alerts).
Very short-term outlook: bearish
Short-term outlook: bearish
MT outlook: bearish
LT outlook: mixed
Trading position (short-term; our opinion): Short positions (which are already profitable) with a stop loss order at 1.2876 are still justified from the risk/reward perspective. We will keep you informed should anything change, or should we see a confirmation/invalidation of the above.
Thank you.
Nadia Simmons
Forex & Oil Trading Strategist
Przemyslaw Radomski, CFA
Founder, Editor-in-chief
Gold & Silver Trading Alerts
Forex Trading Alerts
Oil Investment Updates
Oil Trading Alerts
