

Forex Trading Alert originally sent to subscribers on April 2, 2015, 9:44 AM.
Earlier today, data showed that Canadian trade deficit narrowed to C$0.98 billion in February from C$1.48 billion in January, beating analysts’ expectations. In response to these positive numbers Canadian dollar increased against the greenback, which approached USD/CAD to the long-term support line. Will we see a breakdown in the coming days?
In our opinion the following forex trading positions are justified - summary:
- EUR/USD: none
- GBP/USD: none
- USD/JPY: none
- USD/CAD: short (stop loss order at 1.2876)
- USD/CHF: none
- AUD/USD: none
EUR/USD
The sitution in the medium term hasn’t changed much as EUR/USD still remains above the previously-broken the long-term green support/resistance line. Today, we’ll examine the daily chart once again and look for more clues about future moves.
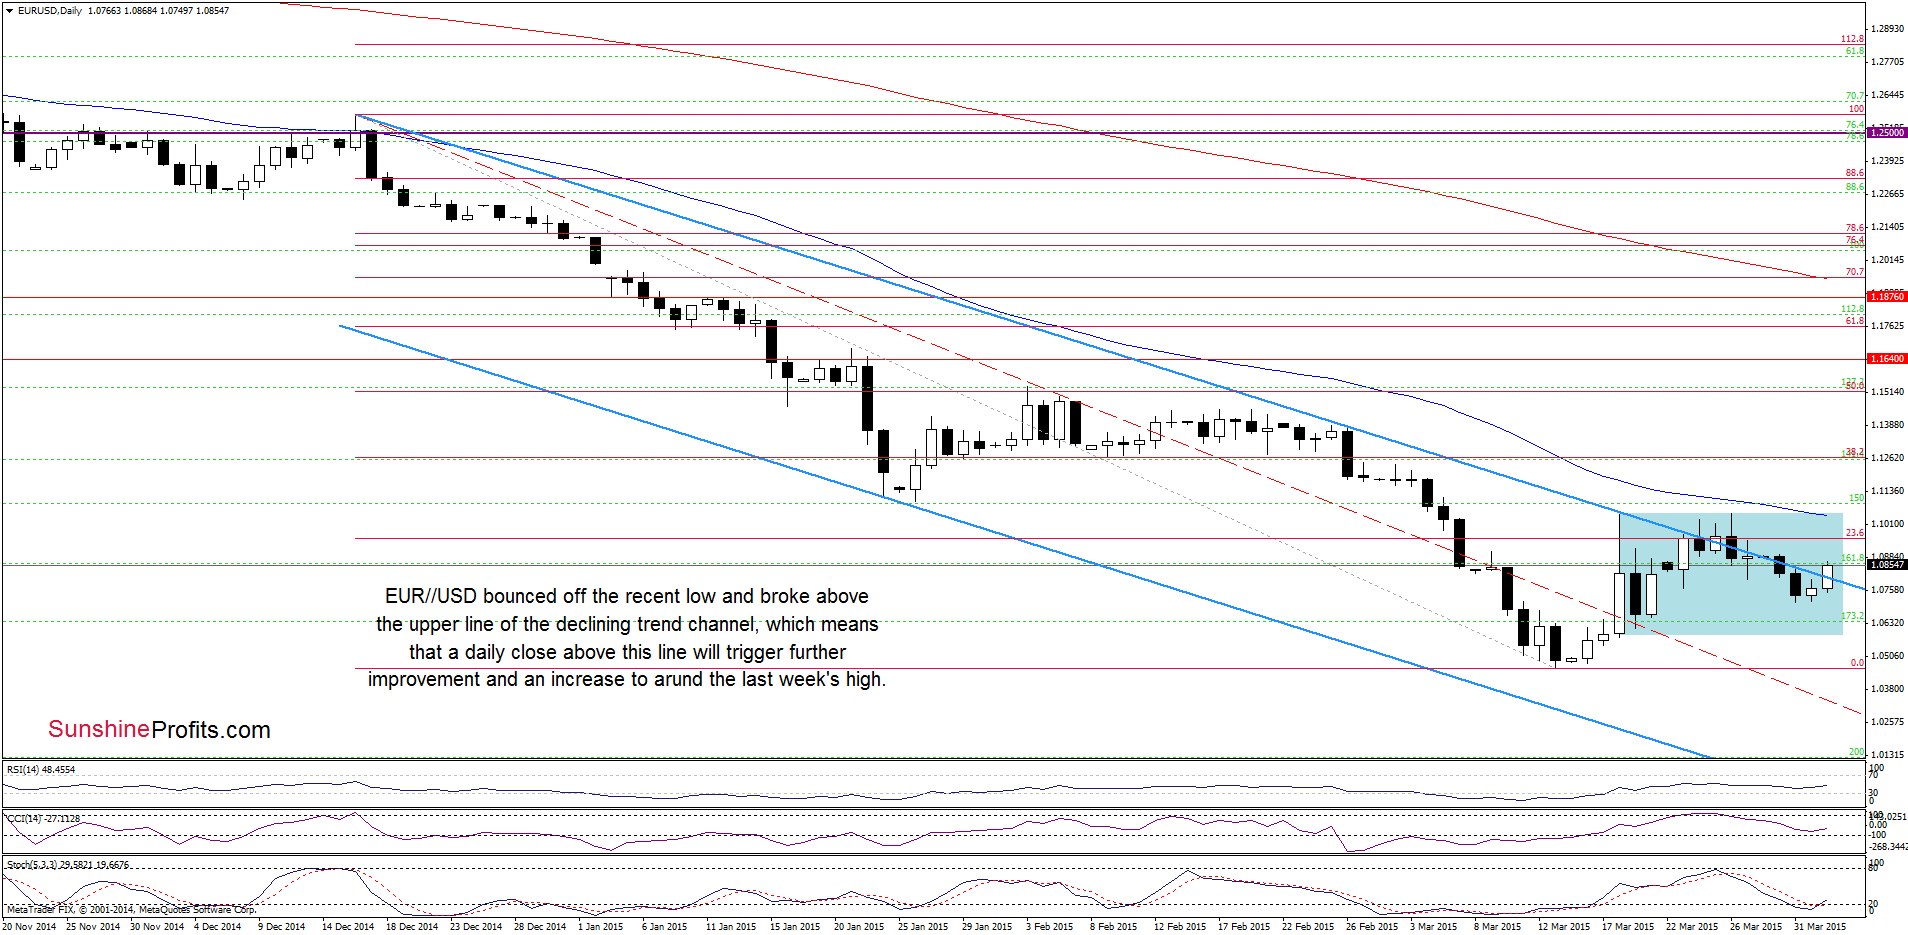
The first thing that catches the eye on the above chart is a breakout above the upper line of the declining trend channel, which is a positive signal (it would be even bullish if we see a daily close above this major resistance line). Additionally, the Stochastic Oscillator generated a buy signal, which together suggest further improvement and an increase to around the last week’s high. At this point it is worth noting that this area (1.1043-1.1051) is also reinforced by the 50-day moving average, which could pause further rally in the coming days. However, if it is broken, we might see a test of the 38.2% Fibonacci retracement around 1.1264.
Very short-term outlook: bullish
Short-term outlook: mixed
MT outlook: mixed
LT outlook: mixed
Trading position (short-term; our opinion): No positions are justified from the risk/reward perspective at the moment. We will keep you informed should anything change, or should we see a confirmation/invalidation of the above.
USD/CAD
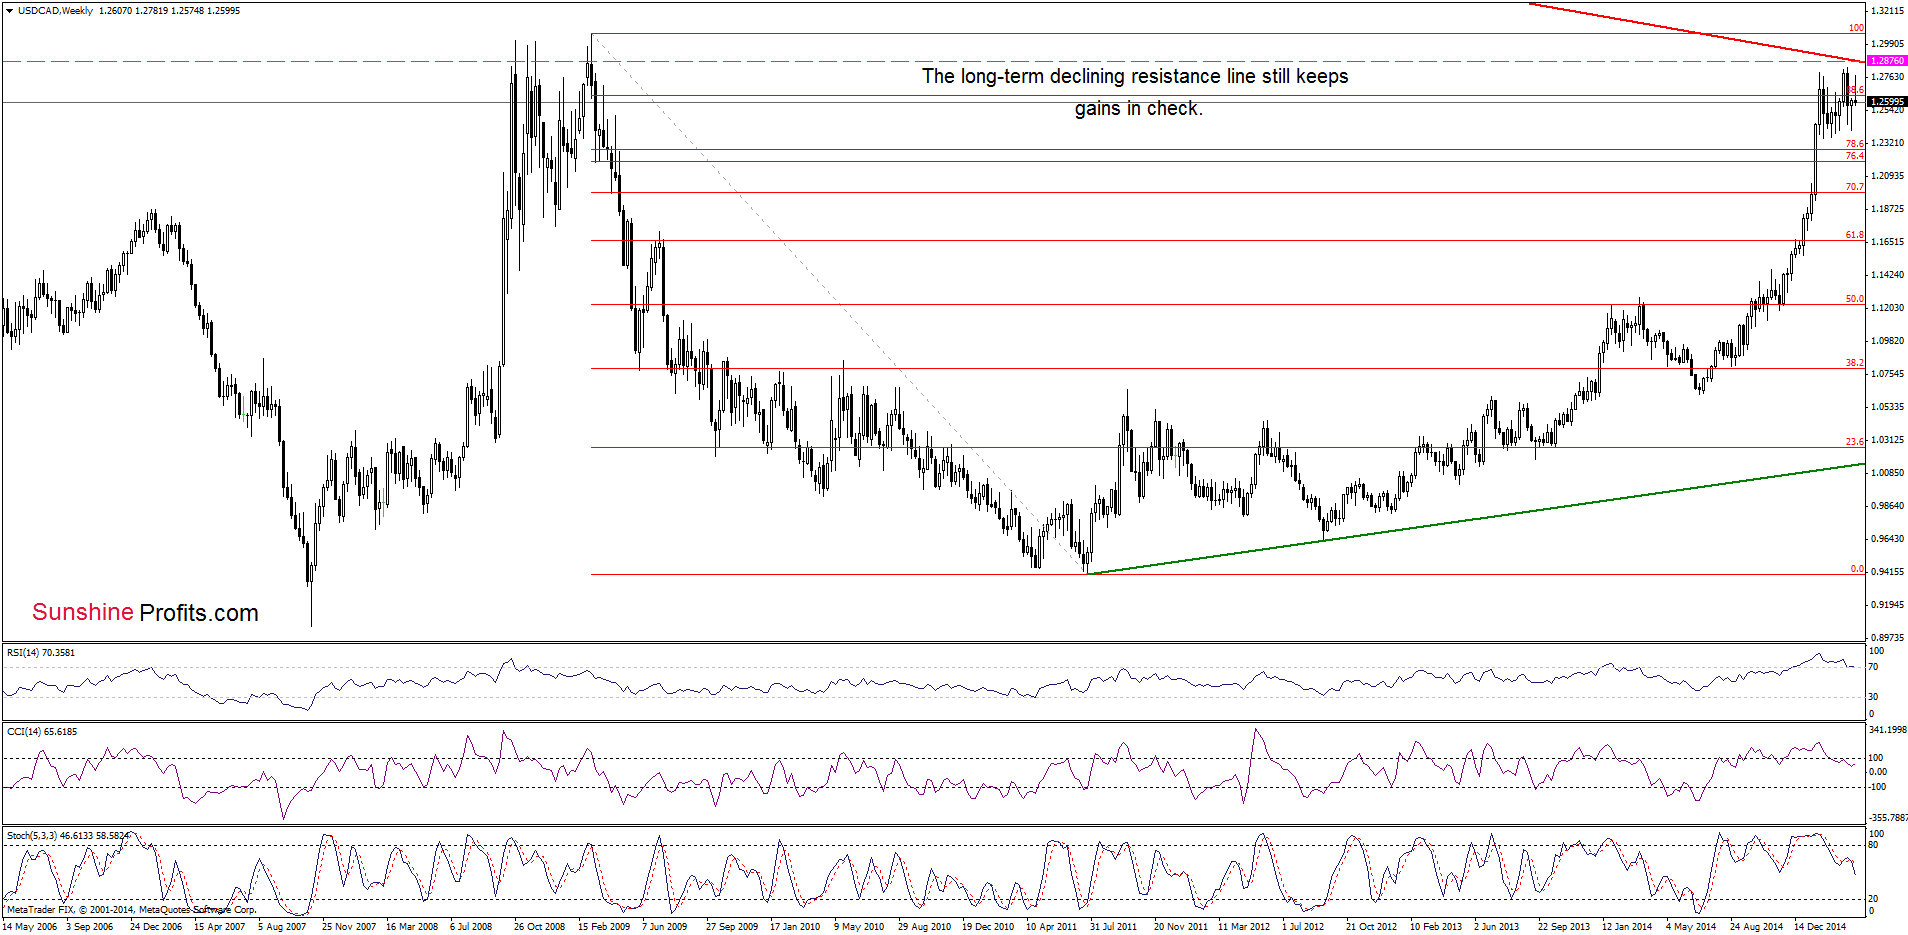
On the weekly chart, we see that USD/CAD is still trading under the long-term red declining resistance line, which keeps gains in check. As a reminder, in the previous weeks, the proximity to this key resistance was enough to trigger a correction. Taking this fact into account, and combining it with sell signals generated by all indicators, we think that further deterioration is just around the corner.
Are there any short-term factors that could support or hinder the realization of the above scenario? Let’s check.
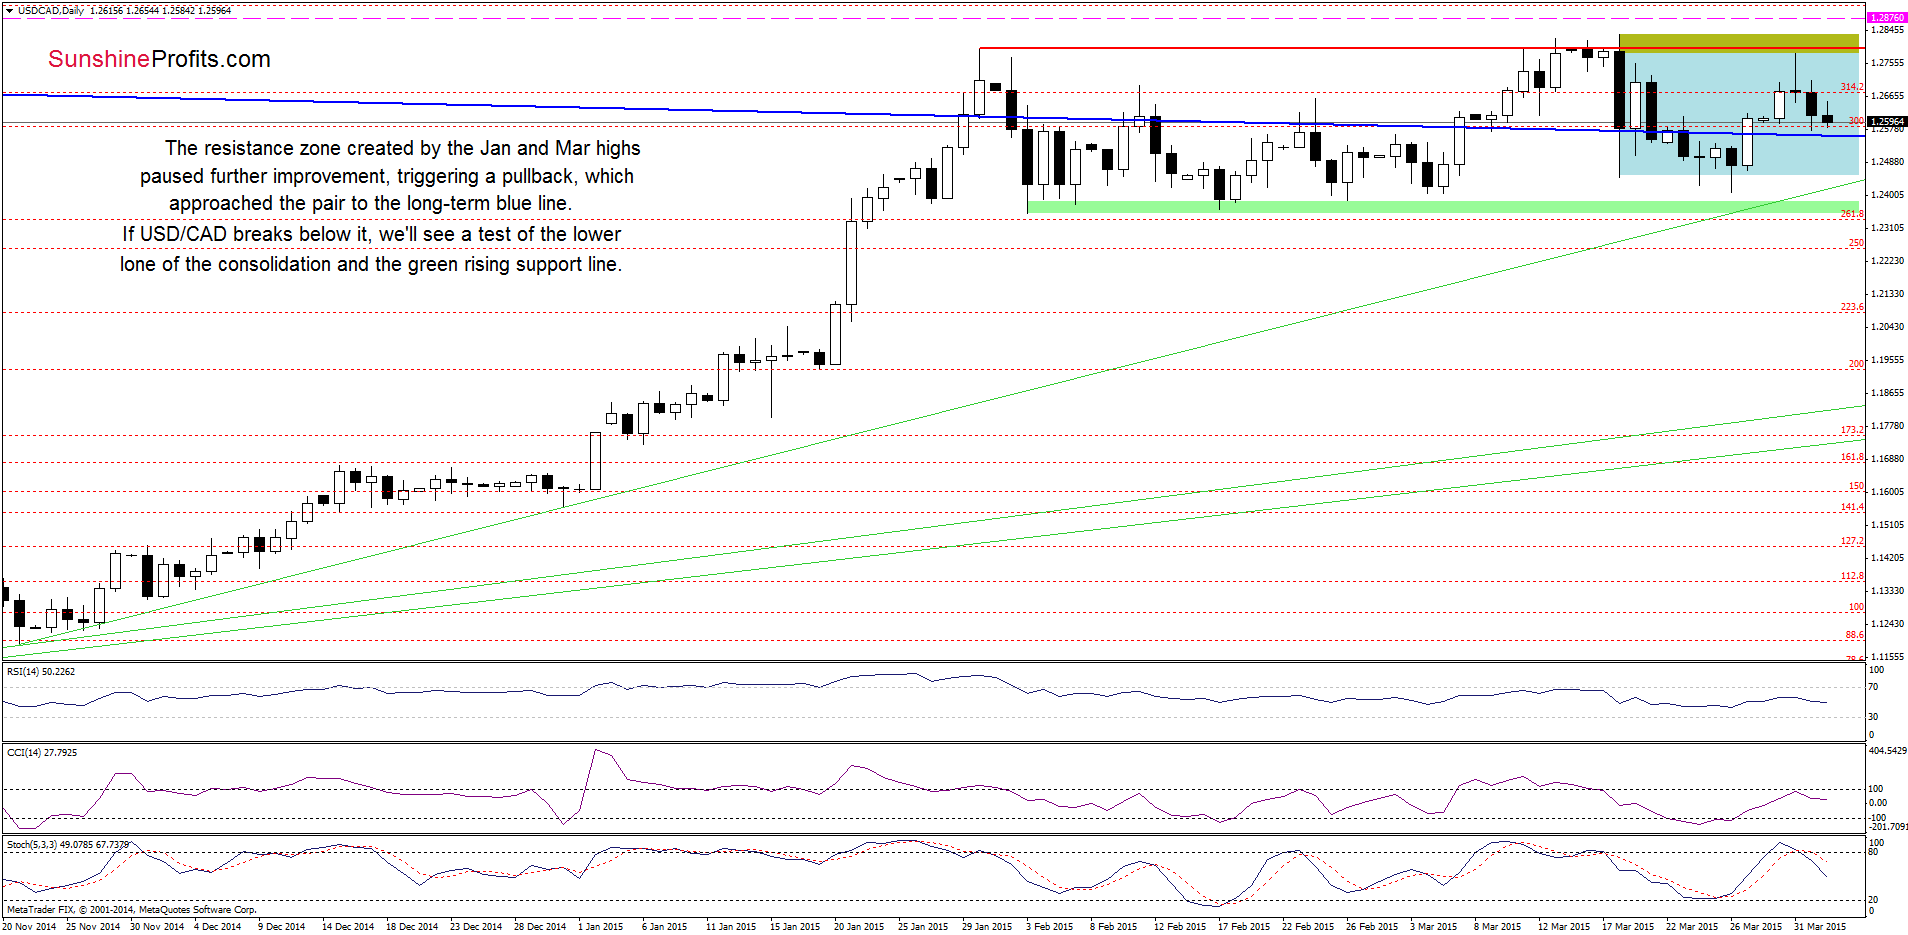
From this perspective, we see that the resistance zone created by the Jan and Mar highs paused further improvement, triggering a pullback, which approached the pair to the long-term blue line. Although USD/CAD could rebound from here, it seems to us that a sell signal generated by the Stochastic Oscillator in combination with the medium-term picture will encourage currency bears to act. If this s the case, we’ll see a breakdown under this support line and a test of the lower border of the consolidation and the green rising support line in the coming days.
Very short-term outlook: bearish
Short-term outlook: mixed with bearish bias
MT outlook: mixed
LT outlook: mixed
Trading position (short-term; our opinion): Short positions with a stop loss order at 1.2876 are justified from the risk/reward perspective. We will keep you informed should anything change, or should we see a confirmation/invalidation of the above.
AUD/USD
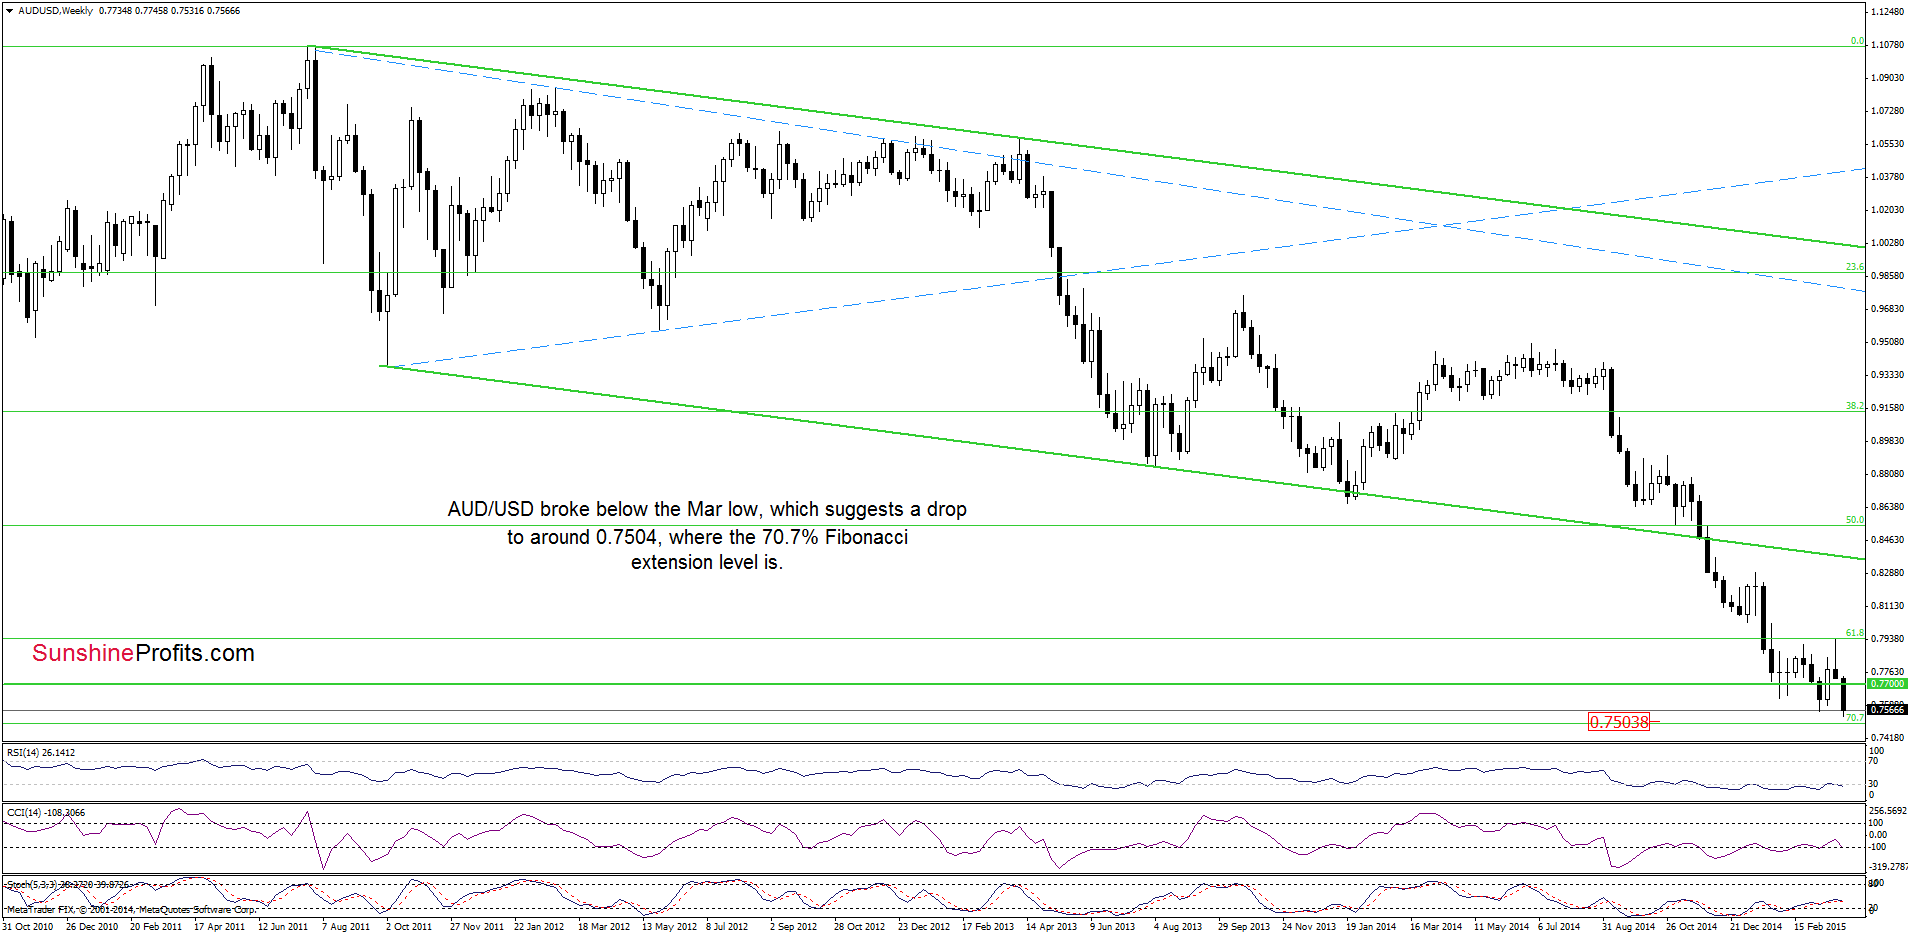
The medium-term outlook has deteriorated as AUD/USD extended losses and broke under the Mar low. This negative signal suggests that if currency bulls don’t invalidate the breakdown and the pair closes the week below 0.7559, we’ll see a drop to around 0.7504, where the 70.7% Fibonacci retracement is.
Having said that, let’s focus on the very short-term changes. What can we infer from the daily chart?
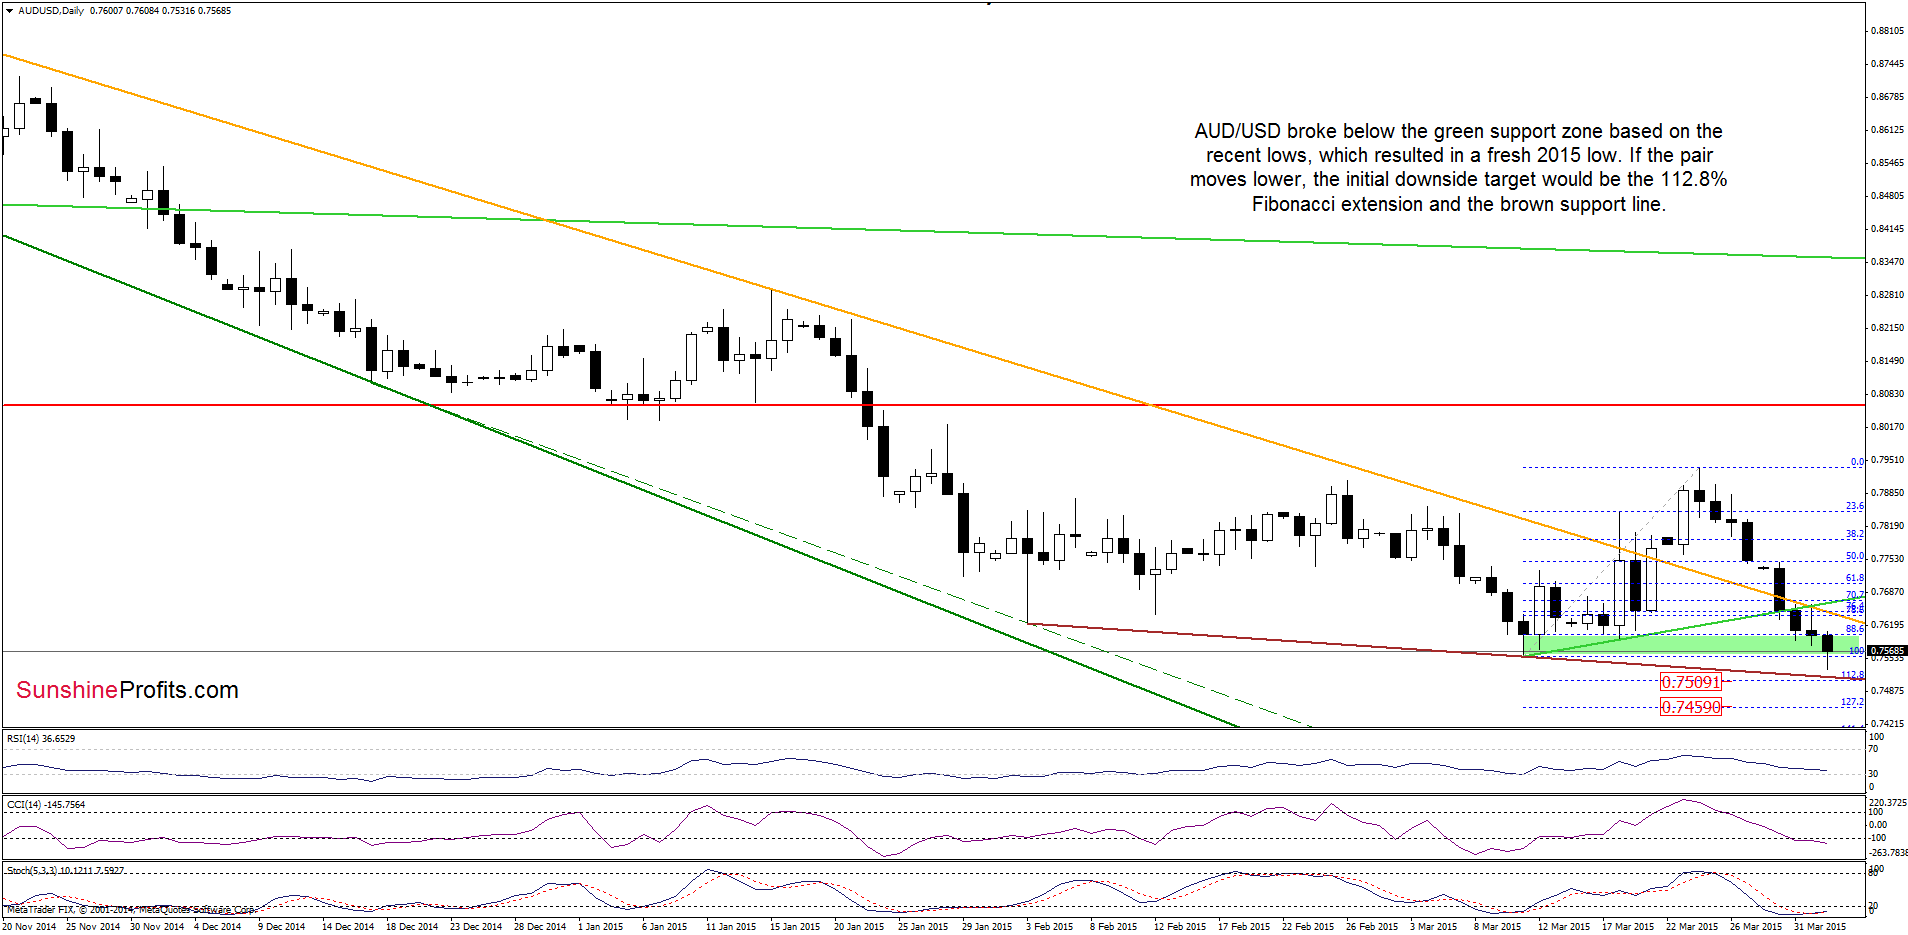
On Monday, we wrote the foowing:
(…) if the exchange rate closes the day uner the green support line based on the recent lows (…) the initial downside target would be at 0.7559 (the Mar 11 low). Please note that if it is broken, the next target for currency bears would be around 0.7542 (…)
Looking at the daily chart, we see that the situation developed in line with the above-mentioned scenario as AUD/USD declined below the Mar low, hitting a fresh 2015 low. This is a negative signal, which suggests further deterioration and a decline to around the 112.8% Fibonacci extension and the brown support line (based on the recent lows). Nevertheless, it seems to us that the proximity to this support area in combination with the current position of the indictors (the CCI and Stochastic Oscillator are oversold, while the latter is very close to generate a buy signal) will encourage currency bulls to act in the coming days. If this is the case, we’ll see an invalidation of the breakdown below the Mar low and an increase to at least the orange resistance line (currently around 0.7642).
Very short-term outlook: mixed with bullish bias
Short-term outlook: mixed
MT outlook: mixed
LT outlook: mixed
Trading position (short-term; our opinion): No positions are justified from the risk/reward perspective at the moment. We will keep you informed should anything change, or should we see a confirmation/invalidation of the above.
Thank you.
Nadia Simmons
Forex & Oil Trading Strategist
Przemyslaw Radomski, CFA
Founder, Editor-in-chief
Gold & Silver Trading Alerts
Forex Trading Alerts
Oil Investment Updates
Oil Trading Alerts
