

Forex Trading Alert originally sent to subscribers on March 3, 2015, 10:02 AM.
Although USD/JPY moved higher earlier today, Etsuro Honda’s (an economic adviser to Prime Minister Shinzo Abe) commentary about implementing additional monetary easing measures by the Bank of Japan triggered a reversal and pushed the greenback lower. As a result, the exchange rate paused its rally slightly below the key resistance zone. Where it head next? North or south?
In our opinion the following forex trading positions are justified - summary:
- EUR/USD: none
- GBP/USD: none
- USD/JPY: none
- USD/CAD: short (stop loss order at 1.2876)
- USD/CHF: none
- AUD/USD: none
EUR/USD
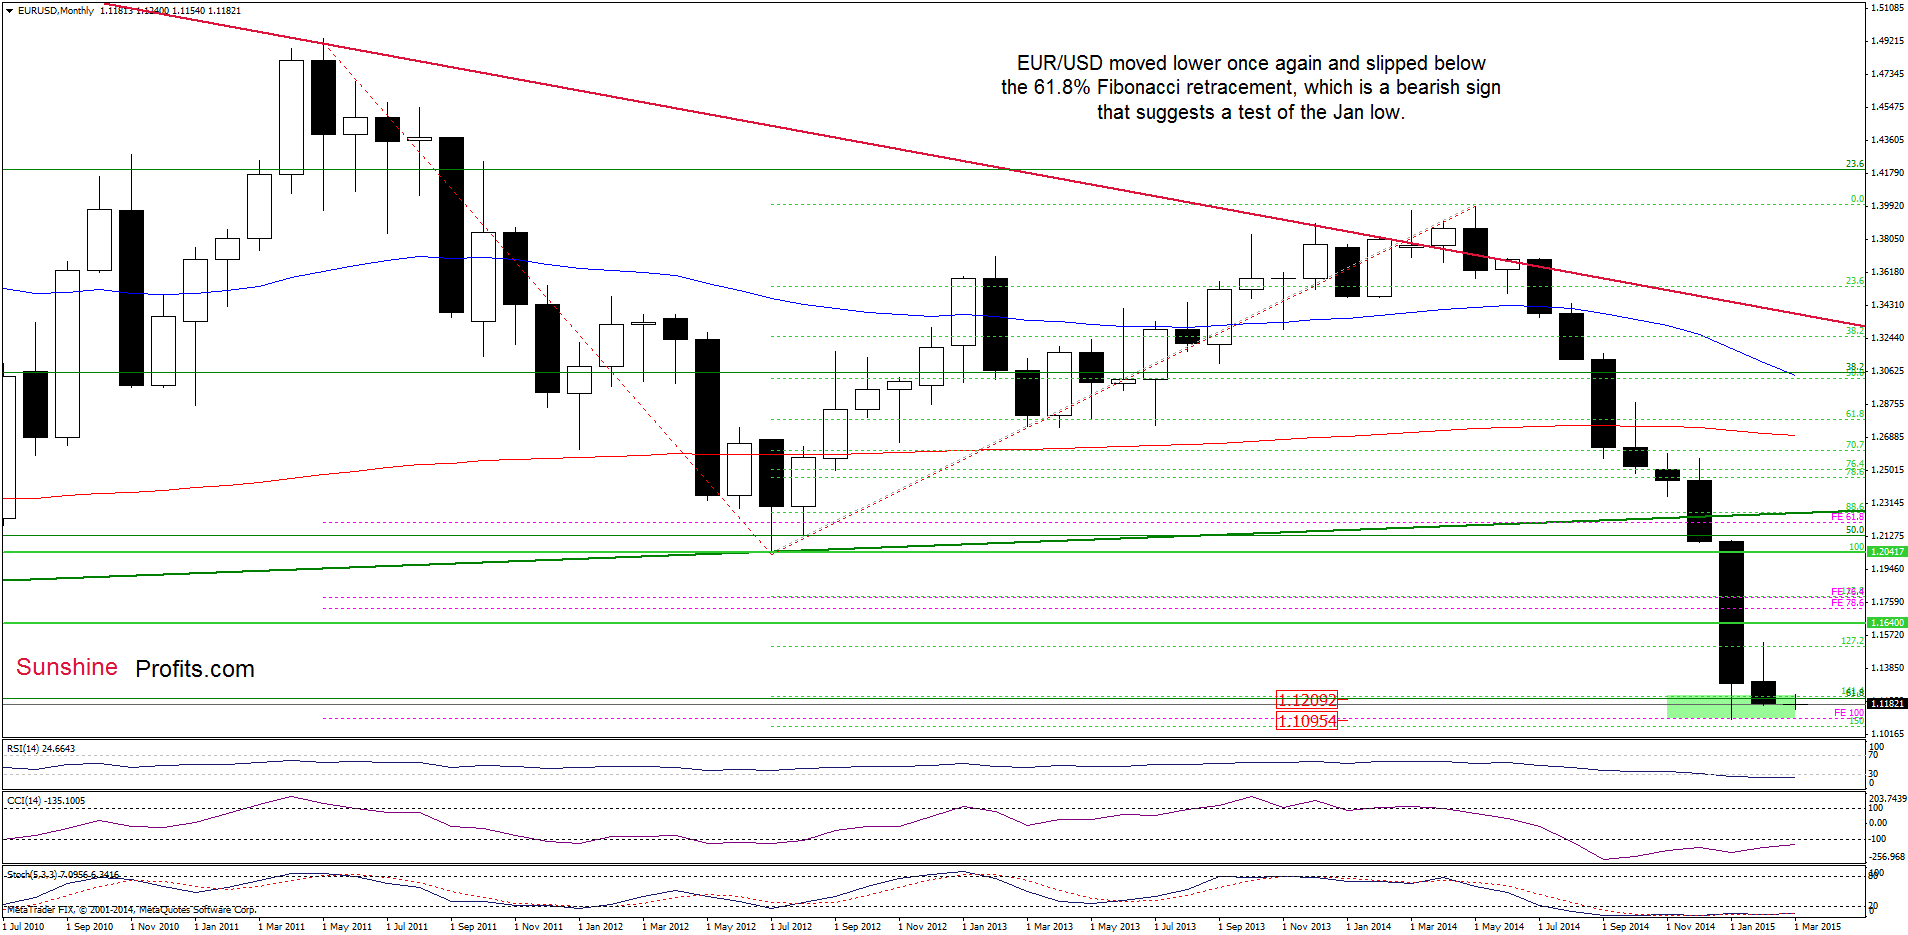
The situation in the medium term has deteriorated once again as EUR/USD reversed and came back below the 61.8% Fibonacci retracement (based on the entire 2000-2008 rally). This is a bearish signal, which suggests that we could see further deterioration in the coming days. Id this is the case, the downside target for currency bears would be the 2015 low of 1.1097.
Will we see such price action? Let’s examine the daily chart and look for more clues about future moves.
On Friday, we wrote the following:
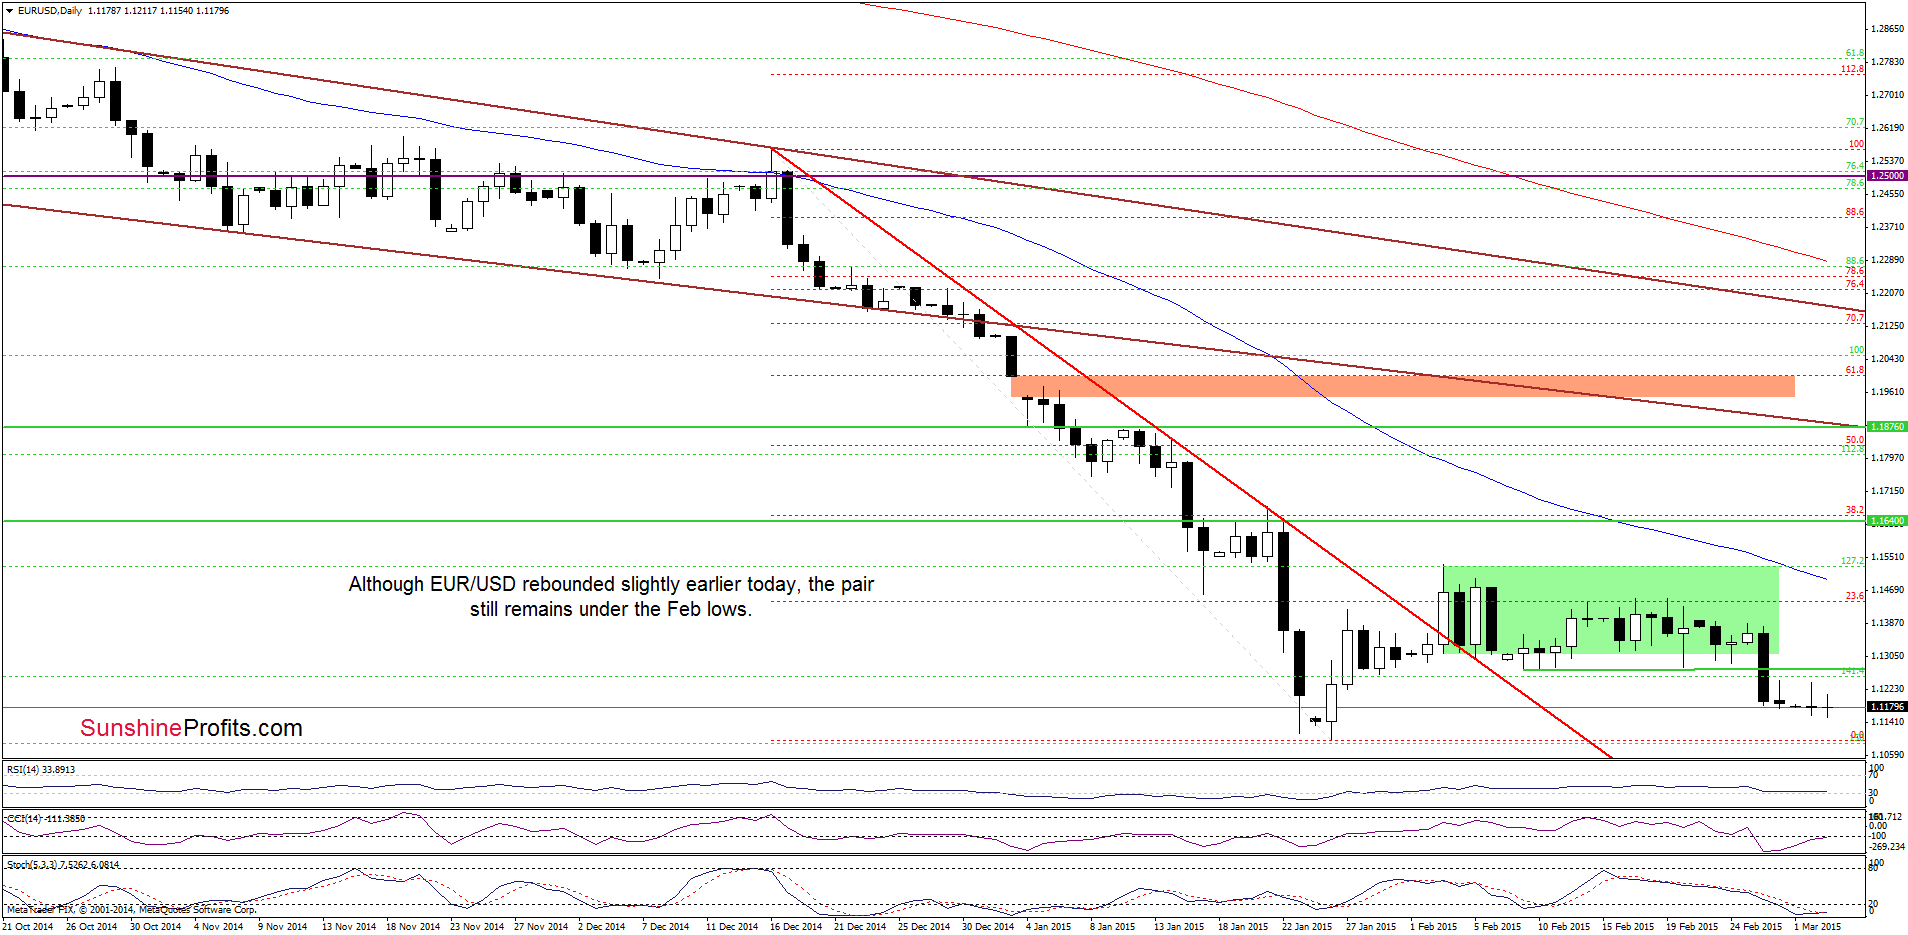
(…) the pair still remains under the previously-broken support/resistance zone created by the Feb lows. (…) What does it mean for the exchange rate? (…) if this area withstands the buying pressure, EUR/USD will reverse and test the above-mentioned 61.8% Fibonacci retracement (based on the entire 2000-2008 rally) once again.
Looking at the charts, we see that the situation developed in line with the above-mentioned scenario. Although the pair moved little higher earlier today, EUR/USD is trading around the last week’s lows, well below the Feb lows. Taking this fact into account, it seems that a test of the Jan low is likely.
Very short-term outlook: mixed with bearish bias
Short-term outlook: mixed
MT outlook: mixed
LT outlook: mixed
Trading position (short-term; our opinion): No positions are justified from the risk/reward perspective at the moment. We will keep you informed should anything change, or should we see a confirmation/invalidation of the above.
USD/JPY
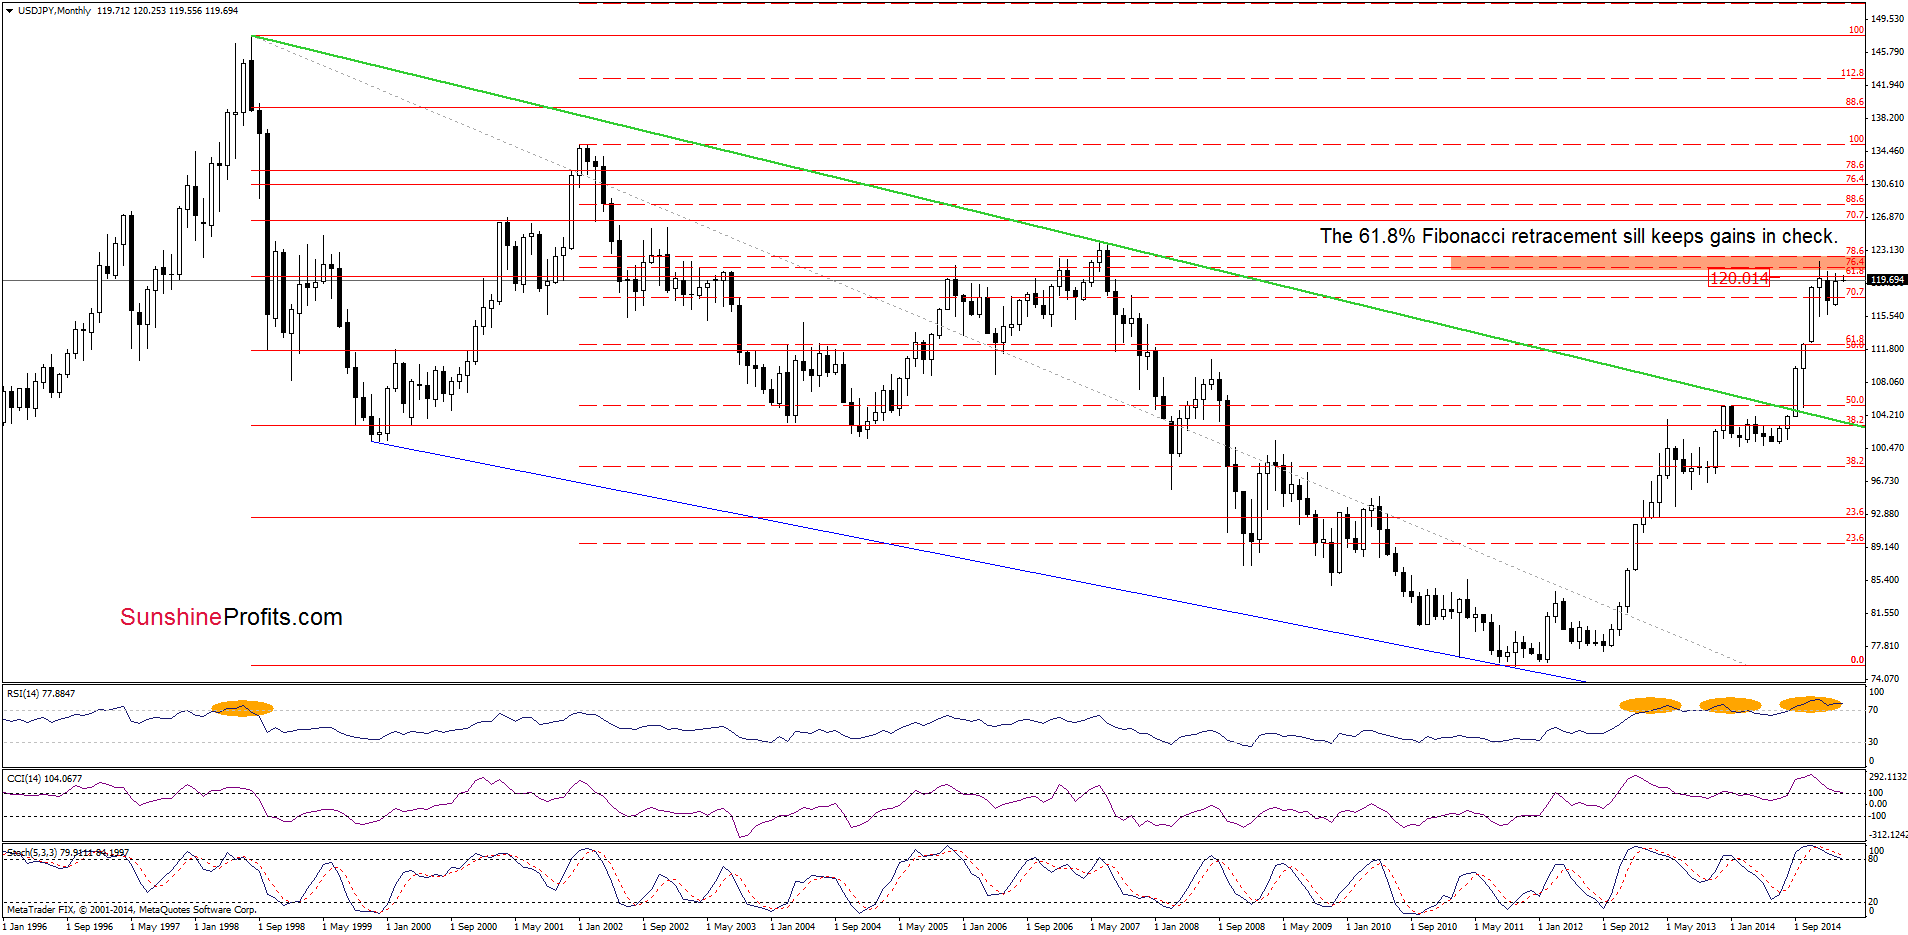
The situation in the medium term hasn’t changed much as the exchange rate still remains under the 61.8% Fibonacci retracement level based on the entire 1998-2011 declines.
Did the very short-trm picture change in the recent days?
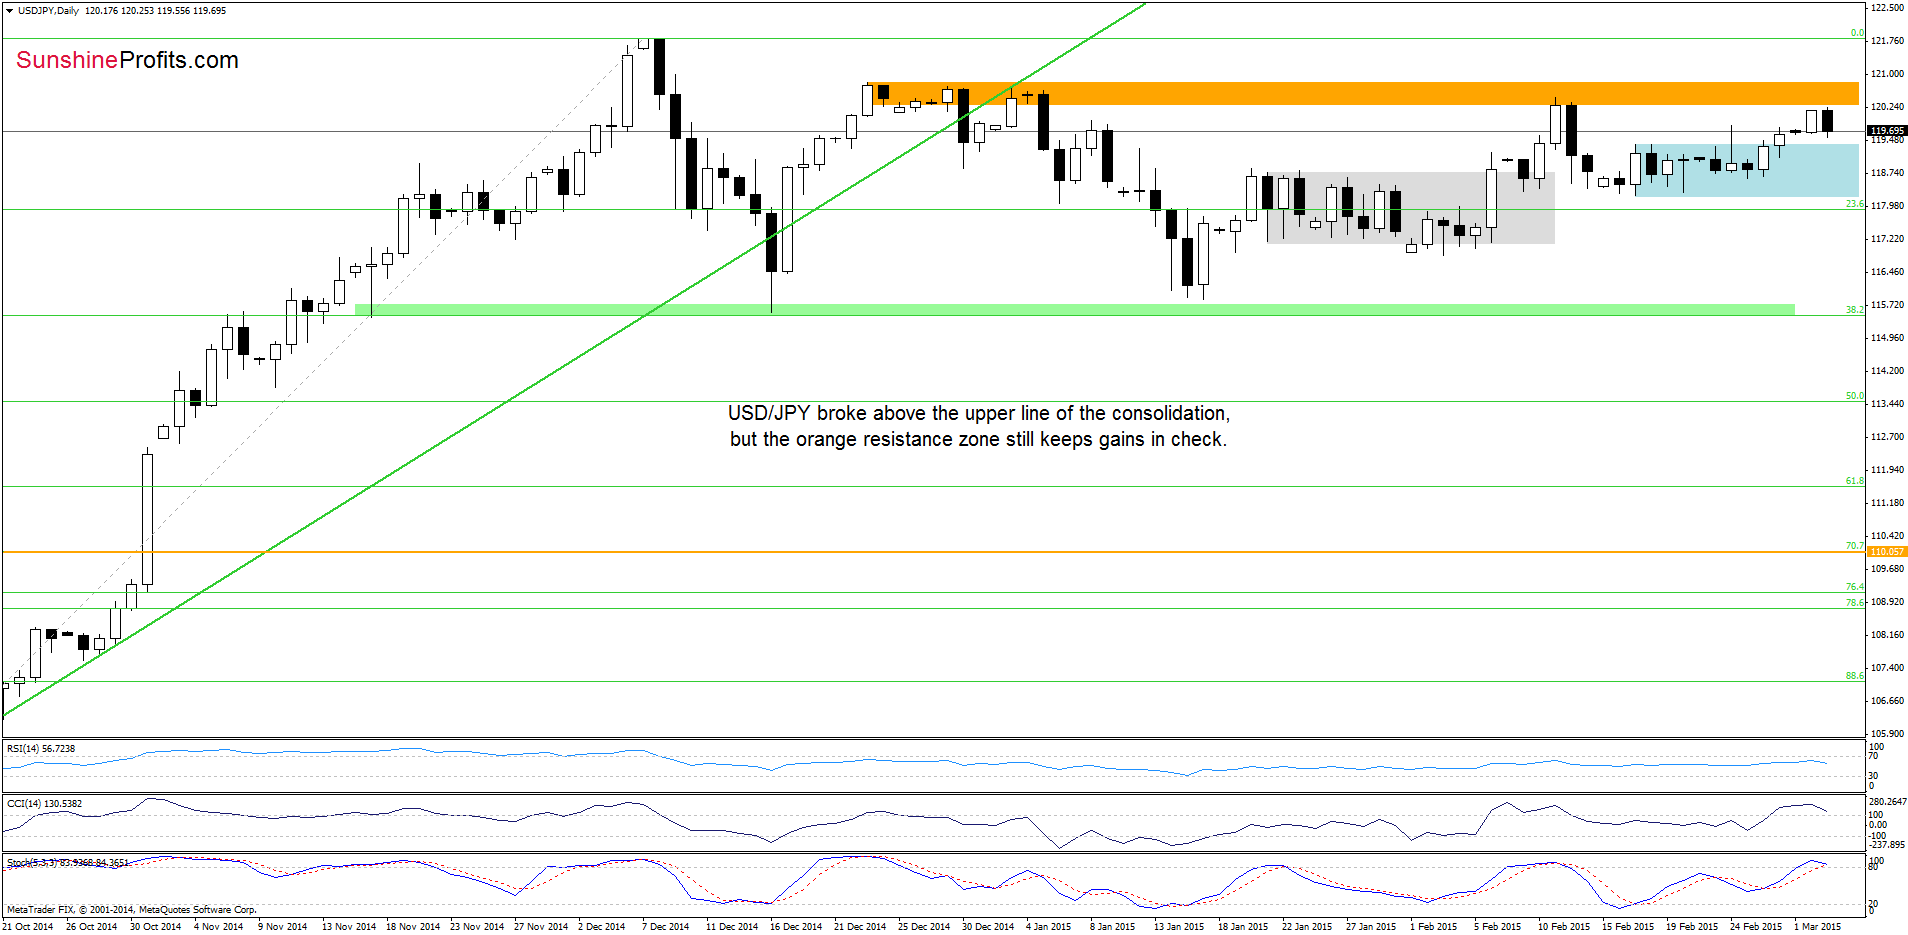
The first thing that catches the eye on the above chart is a breakout above the upper line of the consolidation (marked with blue). Despite this bullish signal and the recent small rally, USD/JPY still remains under the orange resistance zone (reinforced by the above-mentioned 61.8% Fibonacci retracement). Therefore, we believe that as long as this area is in play further ally is questionable. The reason? In the previous weeks, we saw similar attempts to move higher, but as you see on the daily chart, they all failed, which suggests that history will repeat once again – especially when we factor in the current position of the indicators (the CCI and Stochastic Oscillator are overbought and very close to generate sell signals). If this is the case, the initial downside target for currency bears would be around 118.23, where the bottom of the previous correction is.
Very short-term outlook: mixed with bearish bias
Short-term outlook: mixed
MT outlook: mixed
LT outlook: bullish
Trading position (short-term; our opinion): No positions are justified from the risk/reward perspective at the moment. We will keep you informed should anything change, or should we see a confirmation/invalidation of the above.
USD/CAD
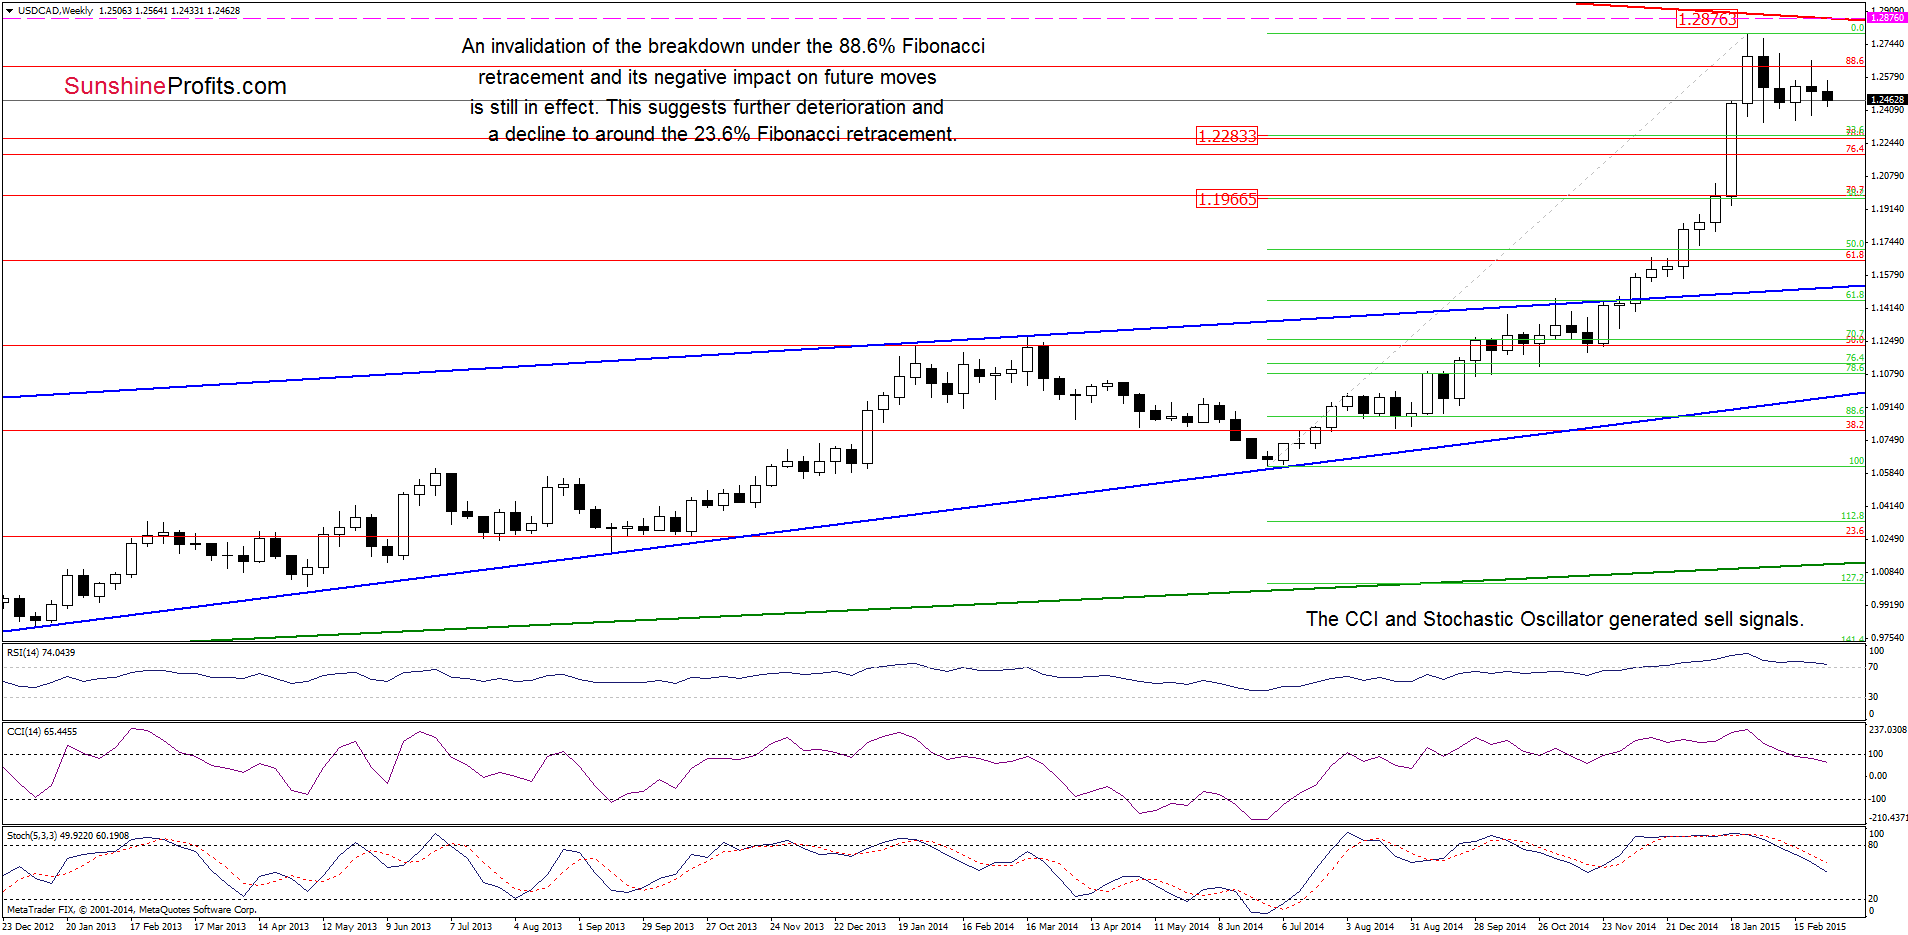
The situation in the medium-term hasn’t changed much as the invalidation of the breakout above the 88.6% Fibonacci retracement and its negative impact on future moves is still in effect. Therefore, our last commentary is up-to-date:
(…) we believe that further deterioration is just around the corner. If this is the case, the initial downside target would be the 23.6% Fibonacci retracement based on the entire Jun-Jan rally (around 1.2275). If it is broken, we’ll see a decline to the 38.2% retracement (at 1.1973) in the coming week. Additionally, sell signals generated by the CCI and Stochastic Oscillator are still in play, supporting the bearish case.
Having said that, let’s check the daily chart.
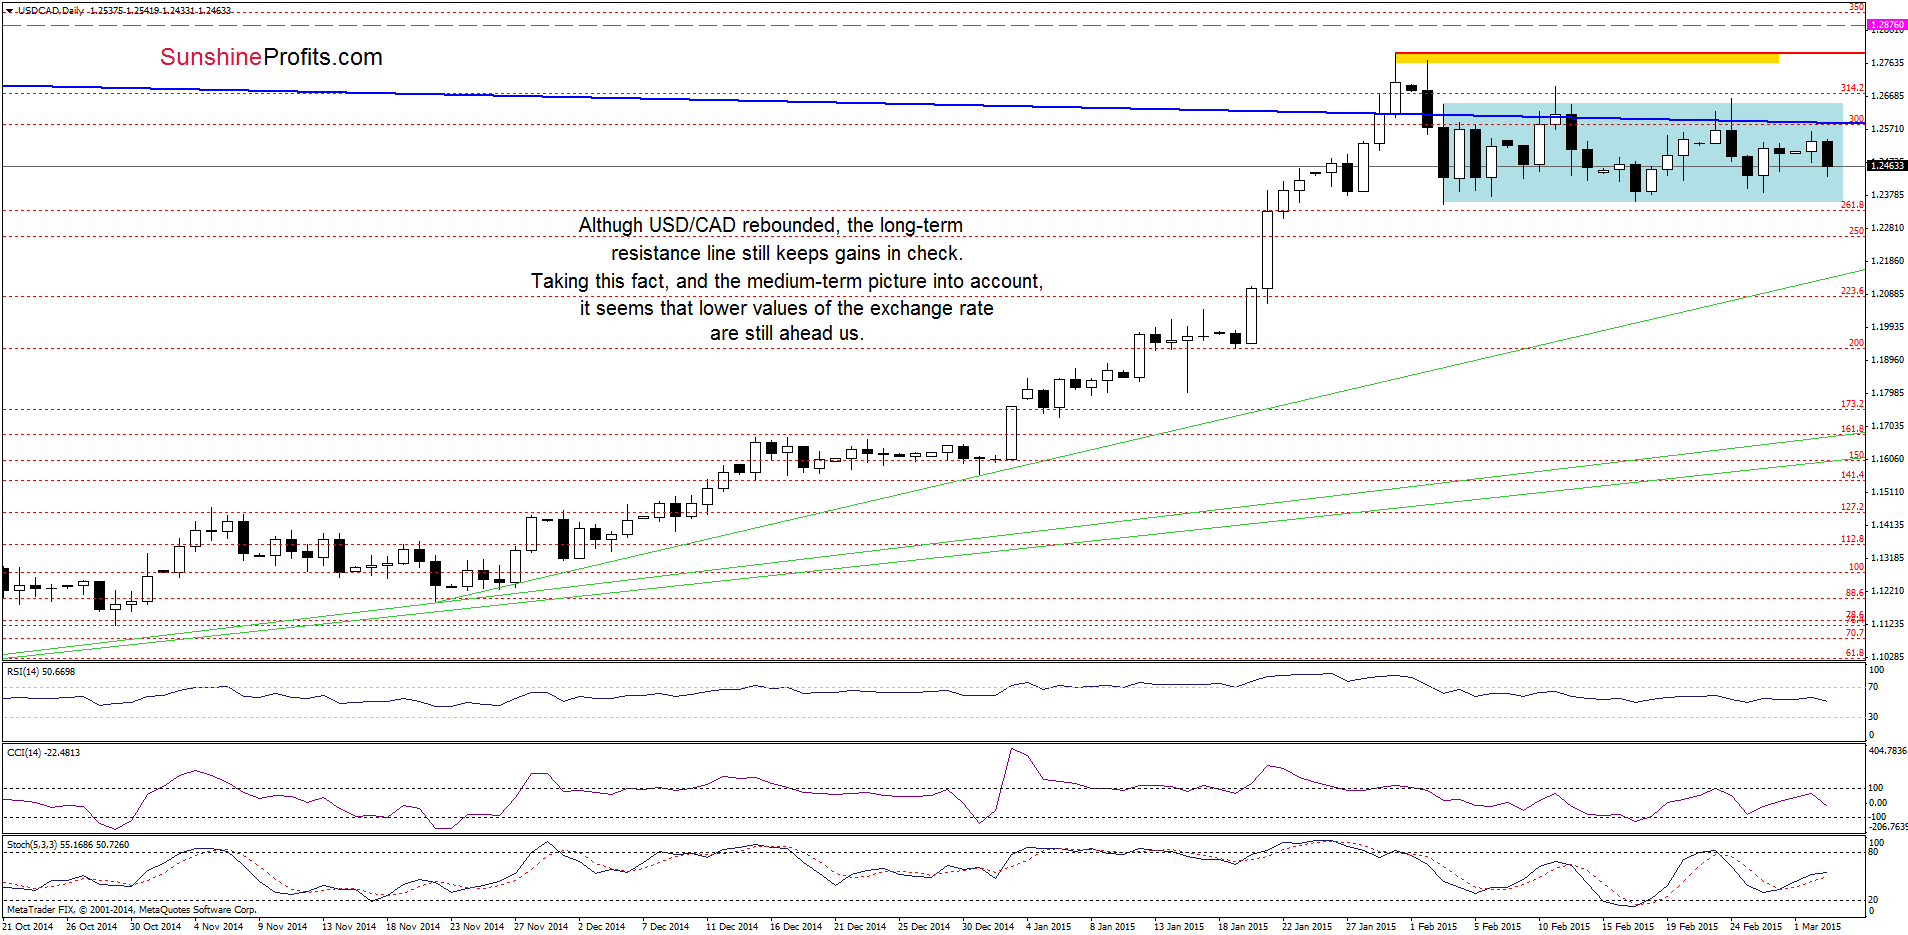
From this perspective, we see that although USD/CAD rebounded slightly in the previous days, this upswing didn’t change anything as the previously-broken long-term blue resistance line still keeps gains in check. Therefore, we think that the next move will be to the downside and the initial downside target would be around 1.2351-1.2361, where the bottoms of the previous pullbacks are.
Very short-term outlook: bearish
Short-term outlook: mixed with bearish bias
MT outlook: mixed
LT outlook: mixed
Trading position (short-term; our opinion): Short positions with a stop loss order at 1.2876 are still justified from the risk/reward perspective. We will keep you informed should anything change, or should we see a confirmation/invalidation of the above.
Thank you.
Nadia Simmons
Forex & Oil Trading Strategist
Przemyslaw Radomski, CFA
Founder, Editor-in-chief
Gold & Silver Trading Alerts
Forex Trading Alerts
Oil Investment Updates
Oil Trading Alerts
