

Forex Trading Alert originally sent to subscribers on February 24, 2015, 10:59 AM.
Although GBP/USD moved lower at the end of the previous week, the exchange rate rebounded sharply yesterday, erasing earlier losses and approaching the Feb high. Will we see the pair above 1.5500 in the coming days?
In our opinion, the following forex trading positions are justified - summary:
- EUR/USD: long (stop loss order at 1.1056)
- GBP/USD: none
- USD/JPY: none
- USD/CAD: short (stop loss order at 1.2876)
- USD/CHF: none
- AUD/USD: none
EUR/USD
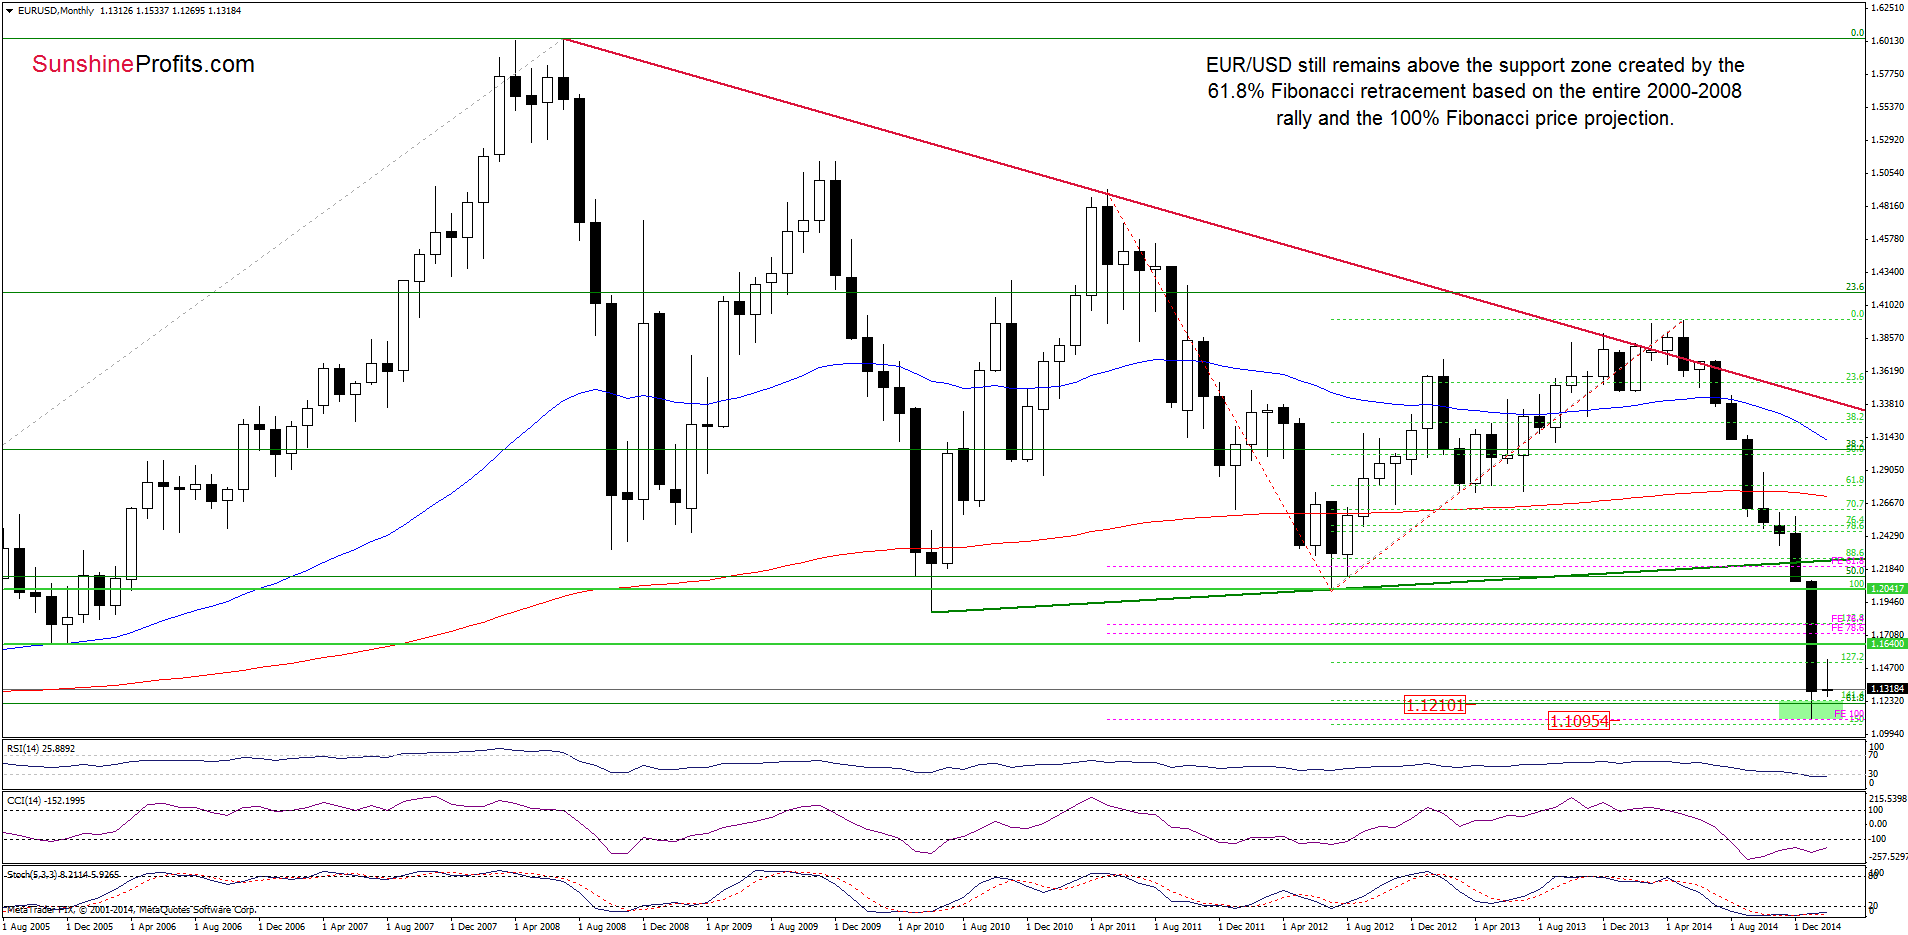
The medium-term hasn’t changed much as EUR/USD still remains above the support zone created by the 61.8% Fibonacci retracement (based on the entire 2000-2008 rally) and the 100% Fibonacci price projection, which means that an invalidation of the breakdown below these levels and its positive impact on the exchange rate are still in effect.
Once we know the above, let’s focus on the very short-term changes.
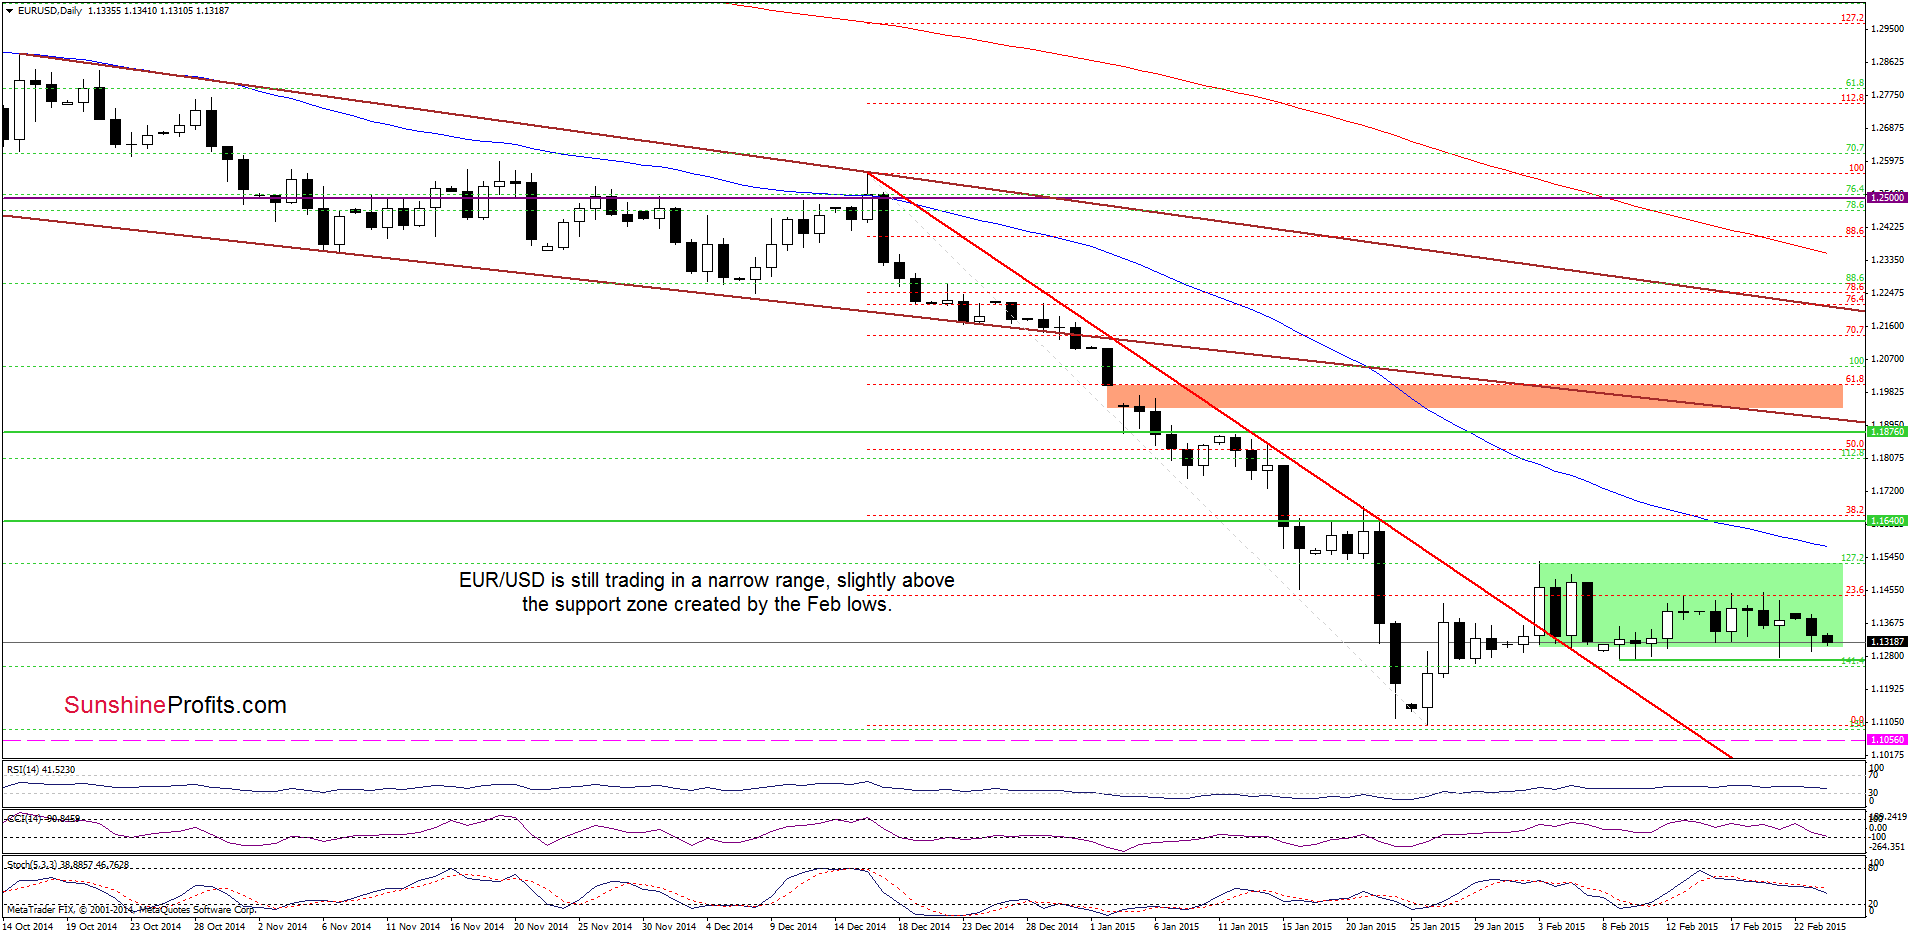
Looking at the daily chart, we see that although EUR/USD moved lower in the recent days, the pair is still trading in a narrow range, slightly above the support zone created by the Feb lows. We think that as long as the exchange rate remains above these levels another upswing and a post double-bottom rally is likely. Nevertheless, if the pair closes the day below this area, it would be a negative signal, which could trigger further deterioration. In this case, we’ll consider closing long positions.
Very short-term outlook: bullish
Short-term outlook: mixed
MT outlook: mixed
LT outlook: mixed
Trading position (short-term): Long positions with a stop loss order at 1.1056 are justified from the risk/reward perspective. We will keep you informed should anything change, or should we see a confirmation/invalidation of the above.
GBP/USD
In our last commentary on this currency pair, we wrote the following:
(…) GBP/USD reversed and slipped to the previously-broken upper border of the consolidation, approaching the long-term green support line. Taking into account buy signals generated by the indicators and the importance of this area it seems that currency bulls will not give up without a fight, which might translate to a rebound from here. If this is the case, it would be a bullish signal, which will be seen as a verification of earlier breakout (it will be even more positive if the pair closes the week above these levels) that could trigger further improvement.
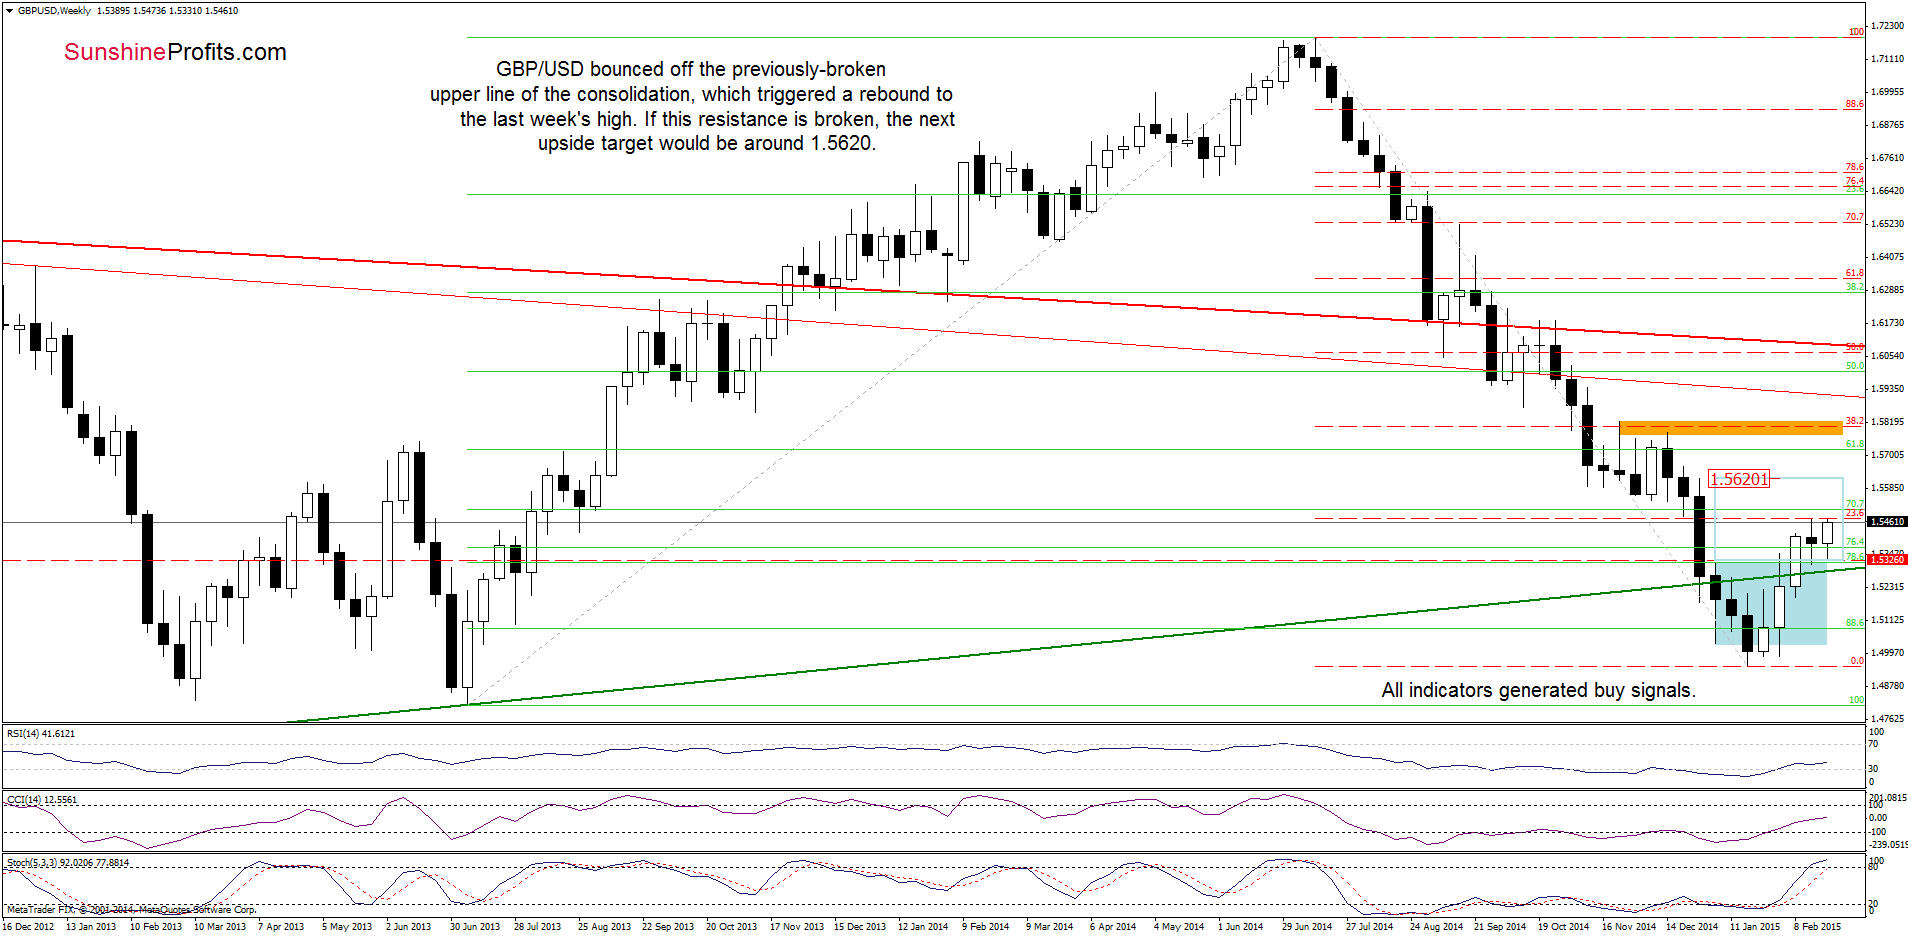
On the weekly chart, we see that currency bulls pushed the pair higher as we expected. GBP/USD closed the previous week above the previously-broken upper border of the consolidation and the long-term green support line, which triggered a rebound and an increase to the last week’s high. This is a positive signal, which suggests that as long as the exchange rate remains above these levels higher values are likely. If this is the case, and the pair moves higher from here, the next upside target would be around 1.5620, where the size of an upswing will correspond to the height of the consolidation and where the Dec 28 high is.
How did this increase affect the very short-term picture? Let’s check.
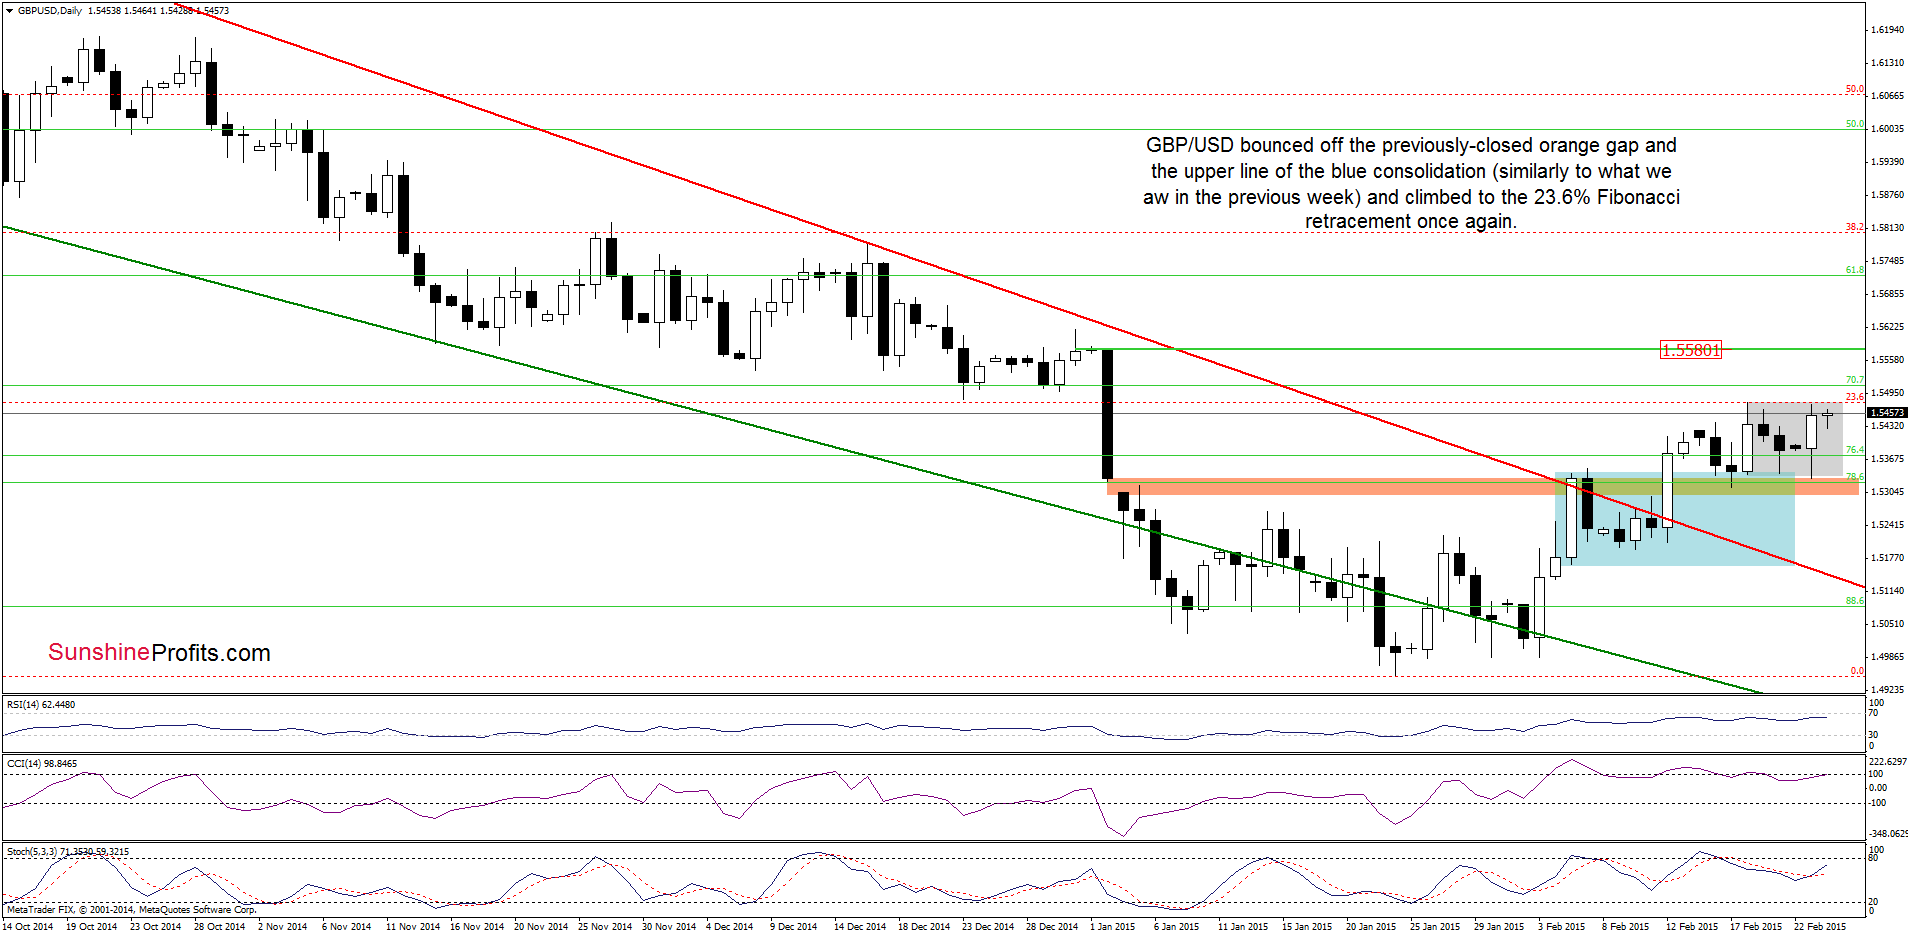
As you see on the daily chart, GBP/USD bounced off the previously-closed orange gap and the upper line of the blue consolidation (similarly to what we saw in the previous week) and climbed to the 23.6% Fibonacci retracement once again. If this resistance holds, we’ll see another pullback from here and a drop to yesterday’s low. On the other hand, if currency bulls manage to push the pair higher, the initial upside target would be around 1.5580-1.5618, where the Jan highs are. Which scenario is more likely? Taking into account buy signal generated by the Stochastic Oscillator and the medium-term picture, we think that higher values of the exchange rate are likely.
Very short-term outlook: mixed
Short-term outlook: mixed with bullish bias
MT outlook: mixed
LT outlook: mixed
Trading position (short-term): In our opinion, no positions are justified from the risk/reward perspective at the moment. We will keep you informed should anything change, or should we see a confirmation/invalidation of the above.
USD/JPY
The situation in the medium term hasn’t changed much as the exchange rate still remains under the 61.8% Fibonacci retracement level based on the entire 1998-2011 declines. Today, we’ll focus on the very short-term picture.
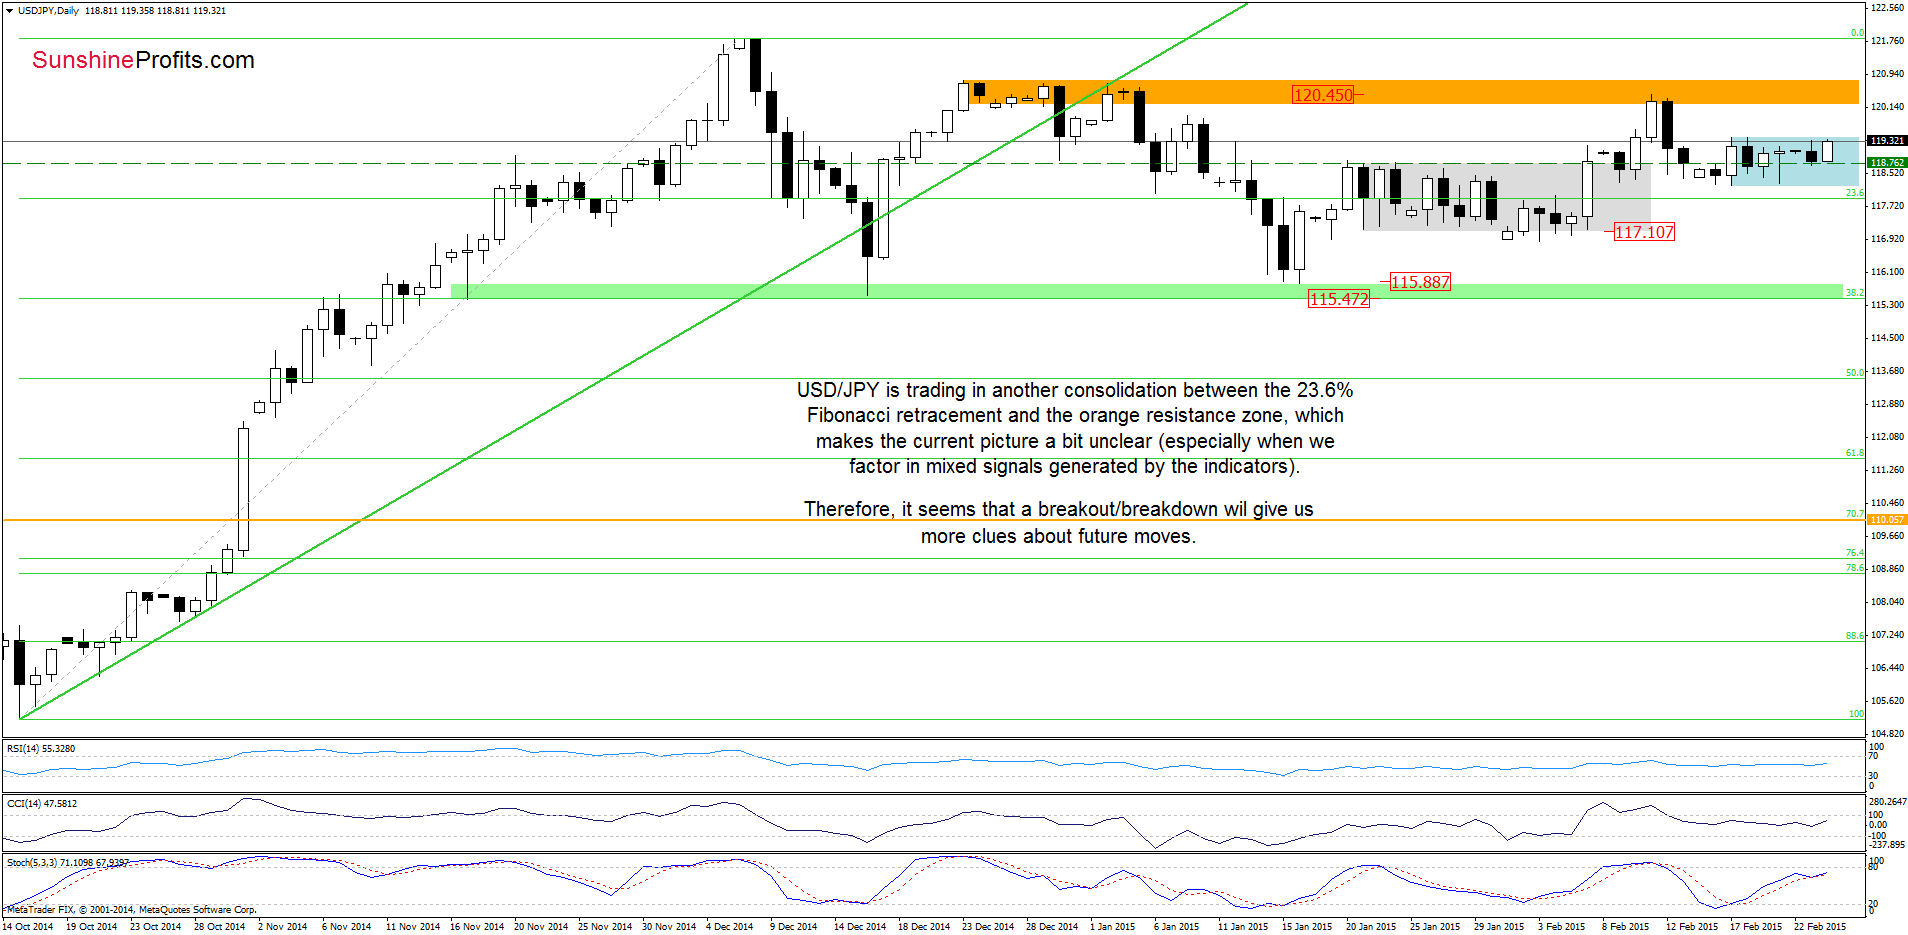
Looking at the daily chart, we see that although USD/JPY moved little higher, the pair is still trading in a narrow range between the 23.6% Fibonacci retracement and the orange resistance zone (reinforced by the above-mentioned 61.8% Fibonacci retracement). Therefore, what we wrote on Friday is up-to-date:
(…) This makes the very short-term situation a bit unclear – especially when we factor in mixed signals generated by the indicators. Therefore, it seems to us that a breakout/breakdown will give us more clues about future moves and indicate the direction of the next bigger move. Until this time, waiting on the sidelines for a profitable opportunity is the best choice.
Very short-term outlook: mixed
Short-term outlook: mixed
MT outlook: mixed
LT outlook: bullish
Trading position (short-term; our opinion): No positions are justified from the risk/reward perspective at the moment. We will keep you informed should anything change, or should we see a confirmation/invalidation of the above.
Thank you.
Nadia Simmons
Forex & Oil Trading Strategist
Forex Trading Alerts
Oil Investment Updates
Oil Trading Alerts
