

Forex Trading Alert originally sent to subscribers on February 19, 2015, 10:15 AM.
Earlier today, the U.S. Department of Labor reported that the number of initial jobless claims in the week ending February 14 dropped by 21,000, beating analysts’ expectations for a fall by 11,000. Thanks to these bullish numbers, USD/CHF extended rally, but how much more room for further gains does the exchange rate have?
In our opinion the following forex trading positions are justified - summary:
- EUR/USD: long (stop loss order at 1.1056)
- GBP/USD: none
- USD/JPY: none
- USD/CAD: short (stop loss order at 1.2876)
- USD/CHF: none
- AUD/USD: none
EUR/USD
The situation in the medium term hasn’t changed much as EUR/USD still remains above the support zone created by the 61.8% Fibonacci retracement (based on the entire 2000-2008 rally) and the 100% Fibonacci price projection, which means that an invalidation of the breakdown below these levels and its positive impact on the exchange rate are still in effect. Therefore, today we’ll focus on the very short-term changes.
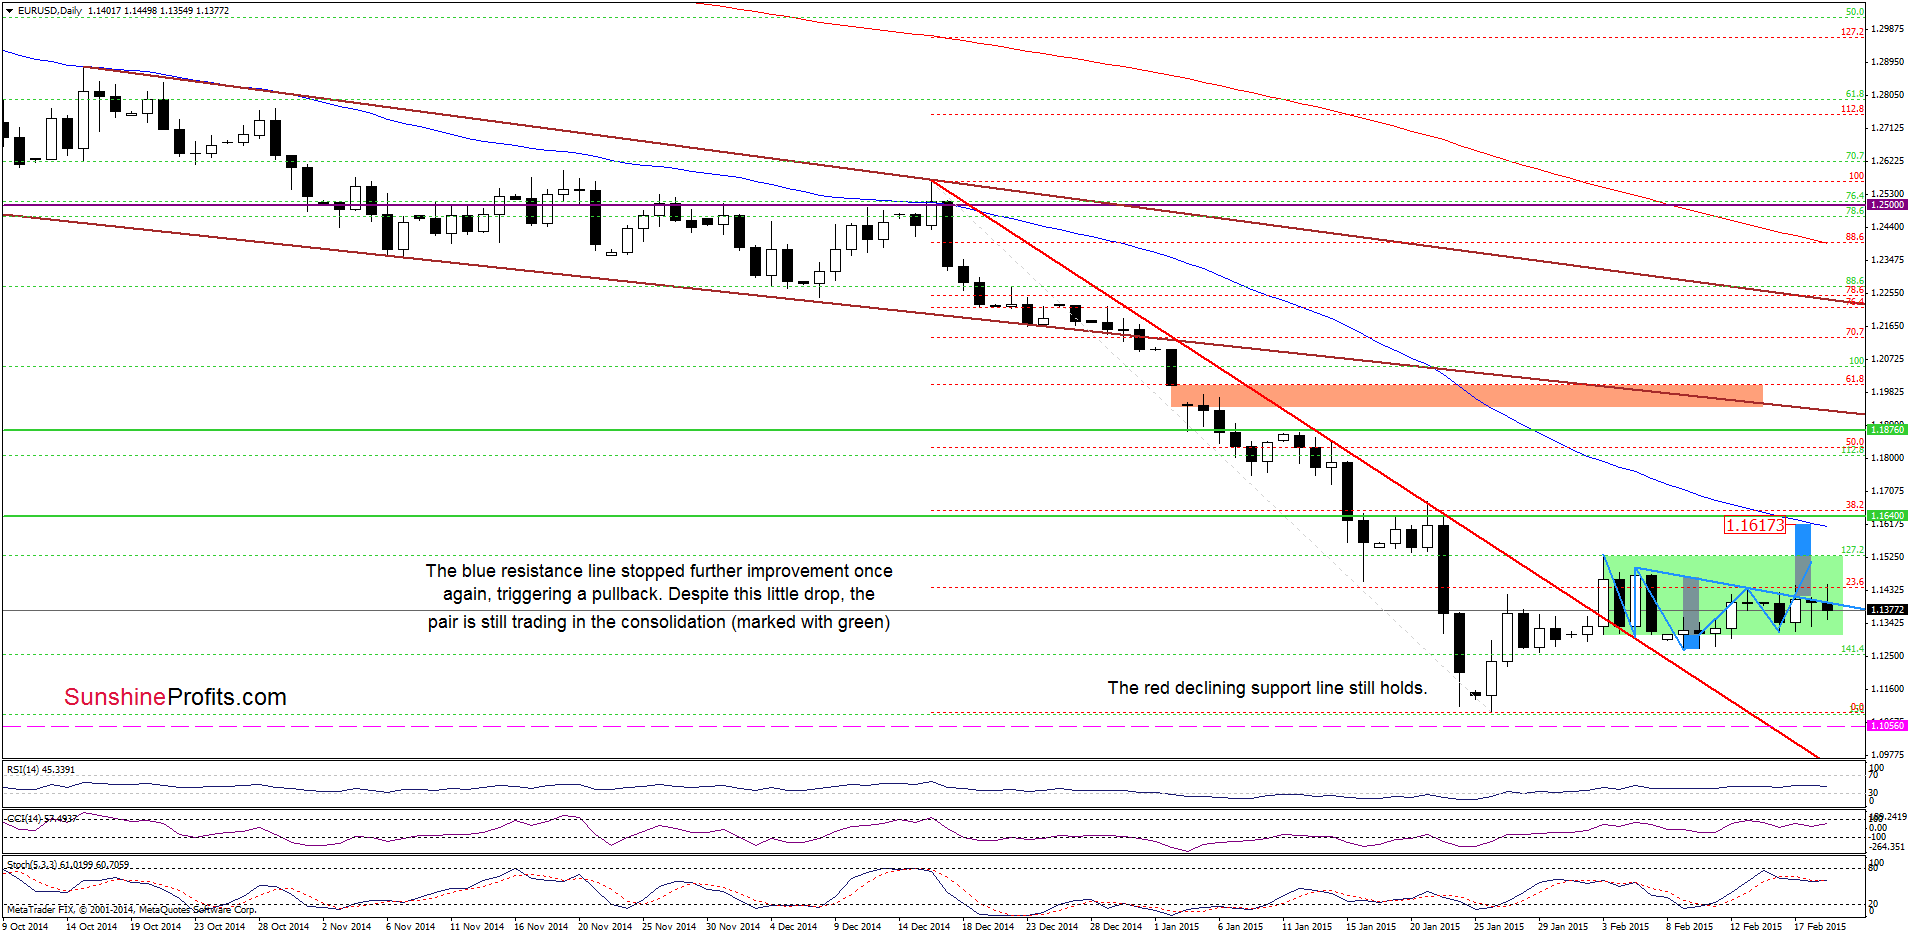
From today’s point of view, we see that although currency bulls tried to push EUR/USD higher, the blue resistance line still keeps gains in check. Nevertheless, as long as there is no breakdown under the right shoulder of the reverse head and shoulders formation another attempt to break above this important line is likely. If we see a breakout, it would be a bullish signal, which will trigger further improvement and an increase to around 1.1617, where the size of an upward move will correspond to the height of the formation and where the previously-broken 50-day moving average is. Nevertheless, before we see a realization of the above-mentioned scenario currency bulls will have to push the pair above 1.1533, where the upper border of the consolidation is.
Very short-term outlook: bullish
Short-term outlook: mixed
MT outlook: mixed
LT outlook: mixed
Trading position (short-term): Long positions with a stop loss order at 1.1056 are justified from the risk/reward perspective at the moment. We will keep you informed should anything change, or should we see a confirmation/invalidation of the above.
USD/CHF
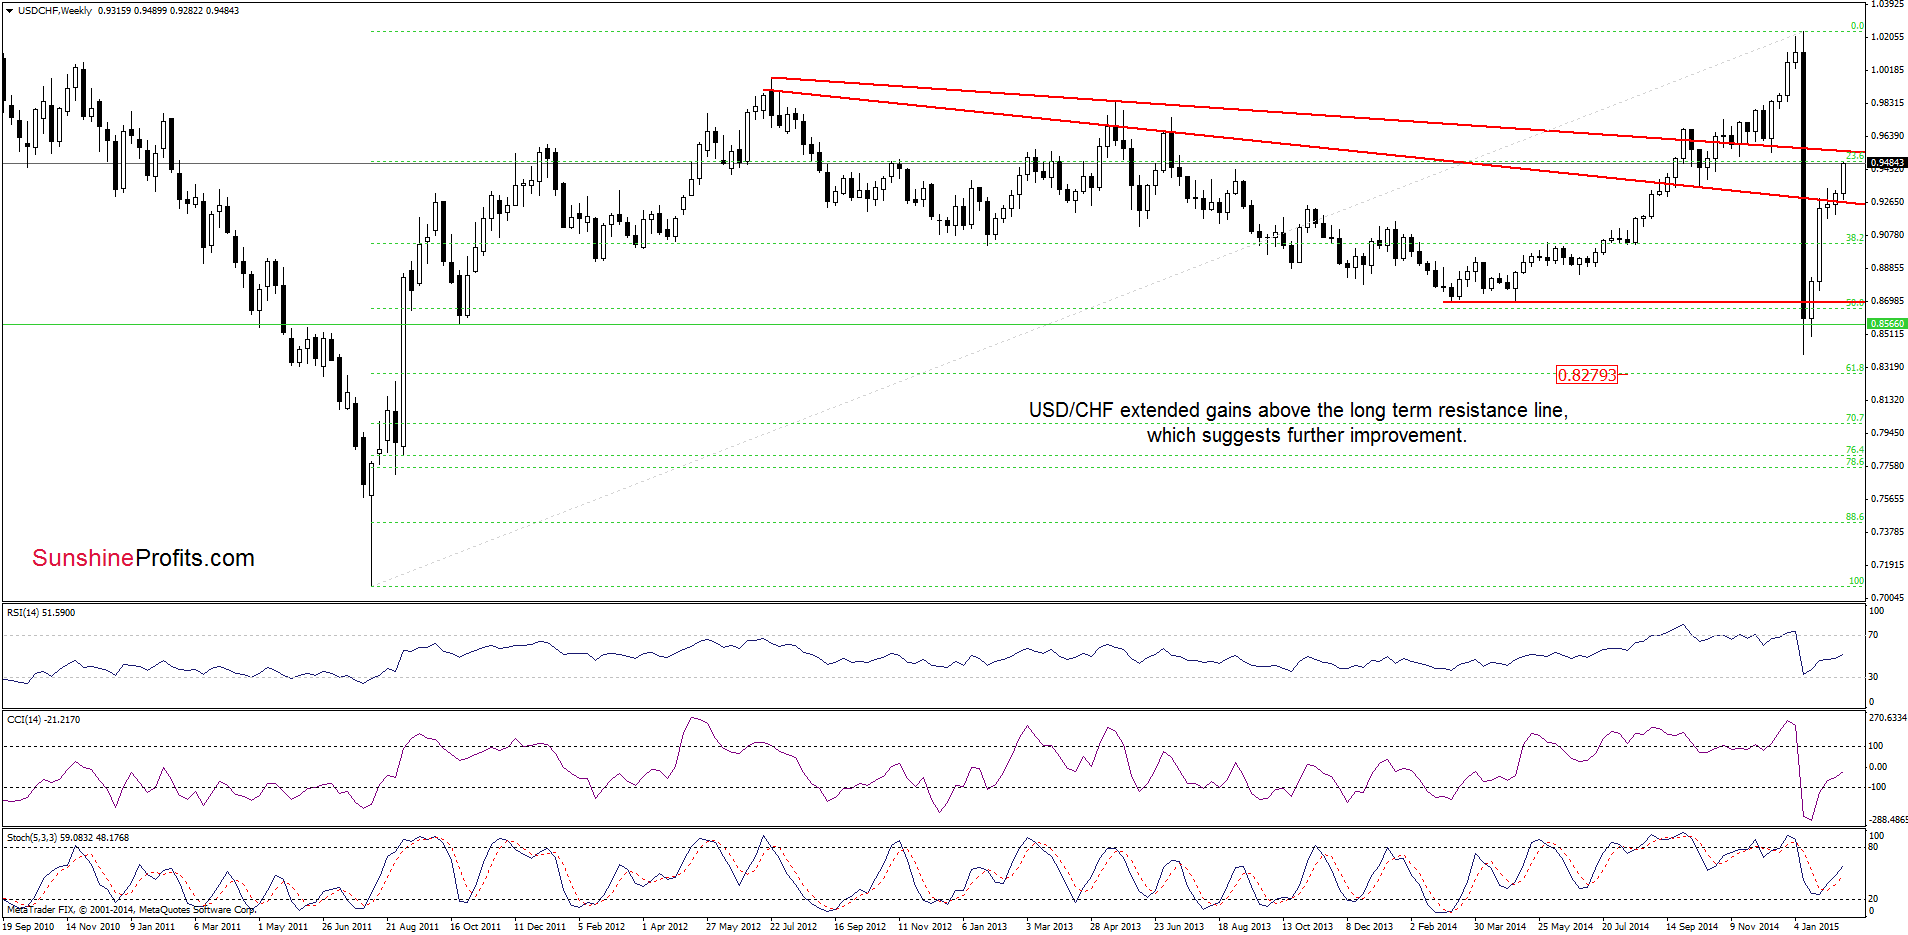
The medium-term picture has improved once again as USD/CHF extended gains above the long-term resistance line (in terms of weekly opening prices).
How did this increase influence the very short-term picture? Let’s zoom in our picture and find out.
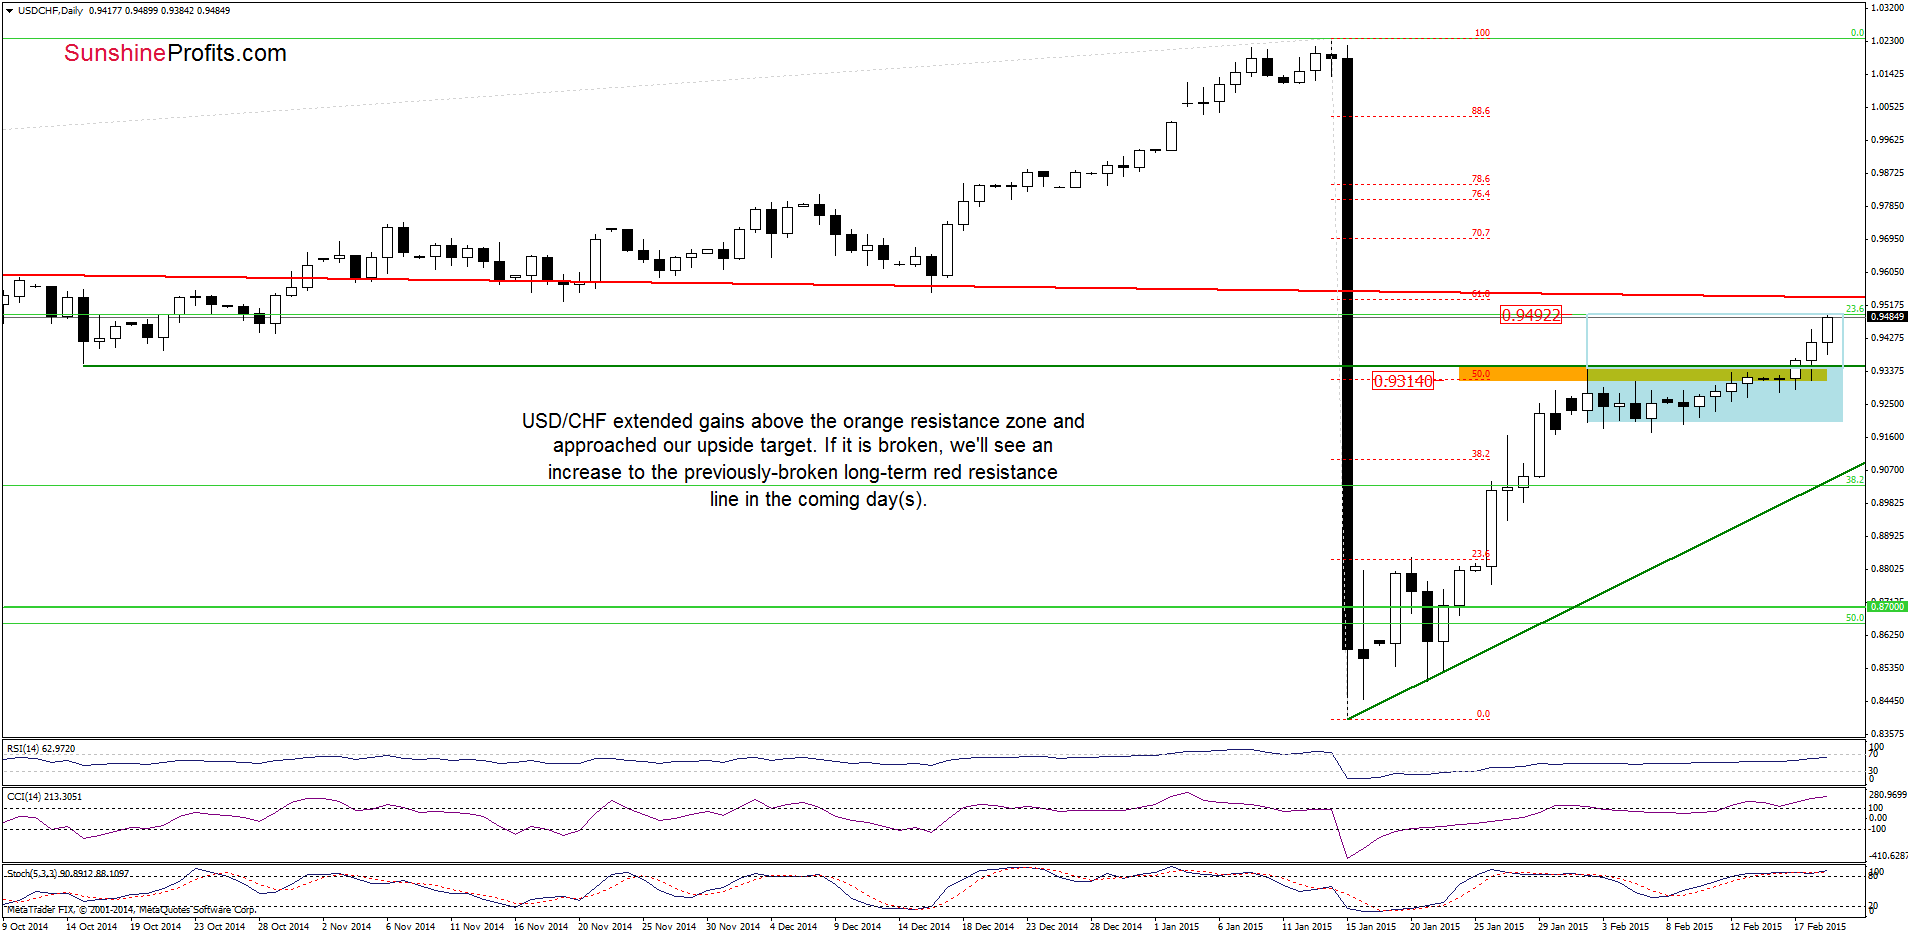
Quoting our previous Forex Trading Alert:
The first thing that catches the eye on the above chart is a breakout above the orange resistance zone (created by the 50% Fibonacci retracement and the Oct 2014 low) and the upper line of the consolidation (marked with blue). This is a bullish signal that suggests further improvement and an increase to around 0.9492, where the size of the upswing will correspond to the height of the formation.
Looking at the daily chart, we see that the situation developed in line with the above-mentioned scenario and USD/CHF reached our upside target earlier today. Taking this fact into account, and combining it with the medium-term picture, we think that yesterday’s commentary is up-to-date:
(…) slightly above this level is the previously-broken long-term red declining resistance line, which will pause or even stop further rally. This scenario is currently reinforced by the position of the indicators (the CCI and Stochastic Oscillator are overbought, which suggests that they could generate sell signals in the coming days, encouraging currency bears to act). Nevertheless, as long as there are no sell signals, higher values of the exchange rate are still ahead us.
Very short-term outlook: bullish
Short-term outlook: mixed with bullish bias
MT outlook: mixed
LT outlook: bearish
Trading position (short-term; our opinion): No positions are justified from the risk/reward perspective at the moment. We will keep you informed should anything change, or should we see a confirmation/invalidation of the above.
AUD/USD
The situation in the medium term hasn’t changed much as an invalidation of the breakdown below the Jul 2009 lows and its potential positive impact on future moves is still in effect.
Having said that, let’s take a closer look at the daily chart.
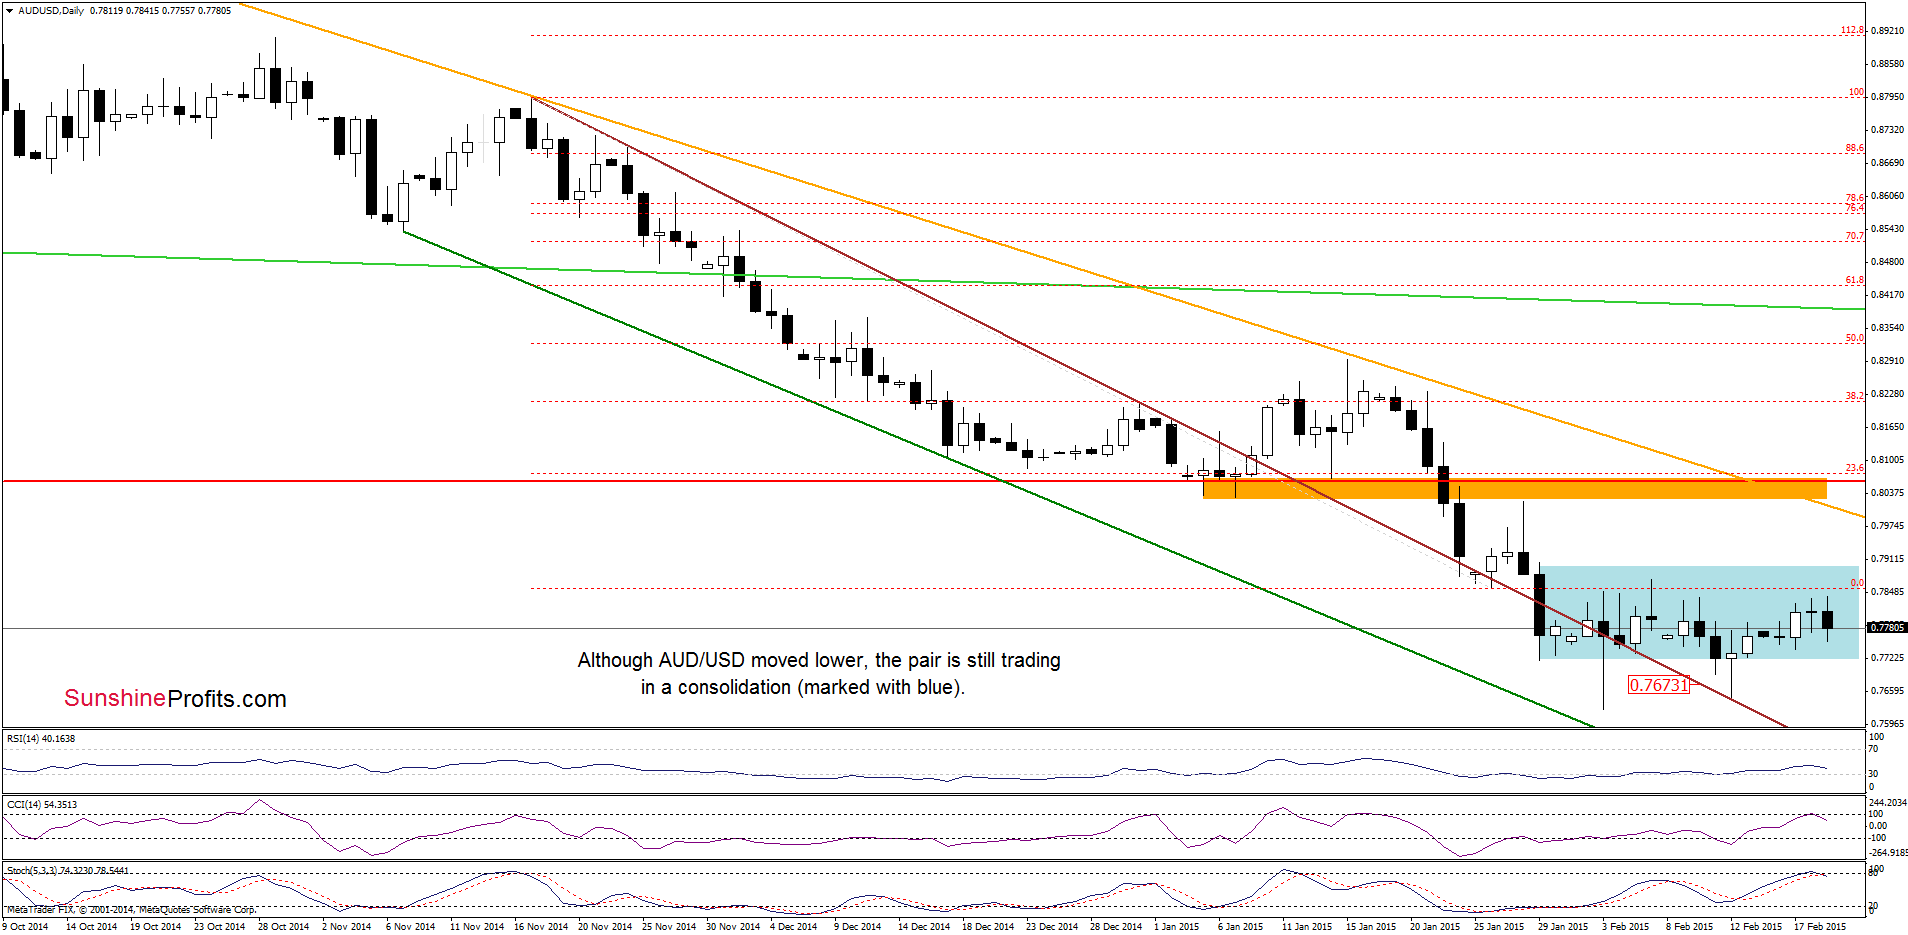
On the above chart, we see that the situation in the very short-term also hasn’t changed much as the exchange rate is still trading in the consolidation. Nevertheless, taking into account the current position of the indicators (the CCI and Stochastic Oscillator generated sell signals), it seems that the pair will move lower and test of the lower border of the formation (around 0.7718) in the coming day(s).
Very short-term outlook: mixed with bearish bias
Short-term outlook: mixed
MT outlook: mixed
LT outlook: mixed
Trading position (short-term; our opinion): No positions are justified from the risk/reward perspective at the moment. We will keep you informed should anything change, or should we see a confirmation/invalidation of the above.
Thank you.
Nadia Simmons
Forex & Oil Trading Strategist
Przemyslaw Radomski, CFA
Founder, Editor-in-chief
Gold & Silver Trading Alerts
Forex Trading Alerts
Oil Investment Updates
Oil Trading Alerts
