
Forex Trading Alert originally sent to subscribers on November 25, 2014, 12:08 PM.
Earlier today, the Conference Board showed that its index of consumer confidence dropped to 88.7 in November, missing analysts’ expectations for an increase to 95.9. In a response, the U.S. dollar moved lower, which pushed the EUR/USD pair to an important resistance line. Will we see a breakout and further improvement?
In our opinion the following forex trading positions are justified - summary:
- EUR/USD: none
- GBP/USD: short (stop-loss: 1.5763; initial price target: 1.5307)
- USD/JPY: none
- USD/CAD: none
- USD/CHF: none
- AUD/USD: none
EUR/USD
The medium-term picture has improved slightly as EUR/USD bounced off the Nov and last week’s low. Today we’ll focus on the very short-term changes.
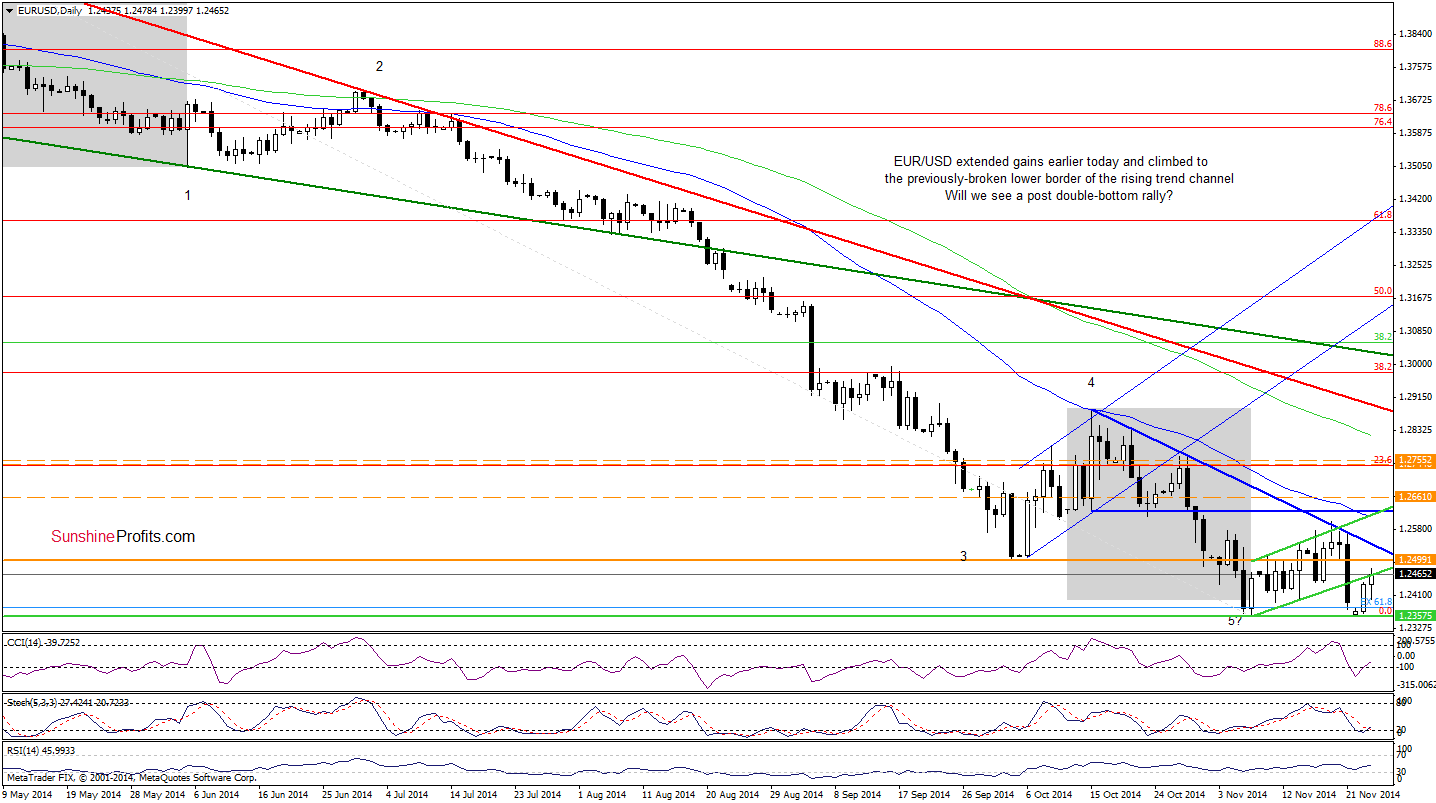
From the very short-term perspective, we see that EUR/USD extnded gains and reached the previously-broken lower line of the trend channel. Therefore, what we wrote yesterday is up-to-date:
(…) we could see a post double-bottom rally in the coming days (especially when we factor in the current position of the indicators). In our opinion, this scenario will be even more likely if the exchange rate invalidates the breakdown below the previously-broken lower line of the trend channel (currently around 1.2457). If this is the case, the next upside target would be the barrier of 1.2500 and the blue declining resistance line (around 1.2550), which stopped the rally in the previous week.
Very short-term outlook: mixed with bullish bias
Short-term outlook: mixed
MT outlook: mixed
LT outlook: bearish
Trading position (short-term): In our opinion, no positions are justified from the risk/reward perspective at the moment. We will keep you informed should anything change, or should we see a confirmation/invalidation of the above.
USD/JPY
In our last commentary on this currency pair, we wrote the following:
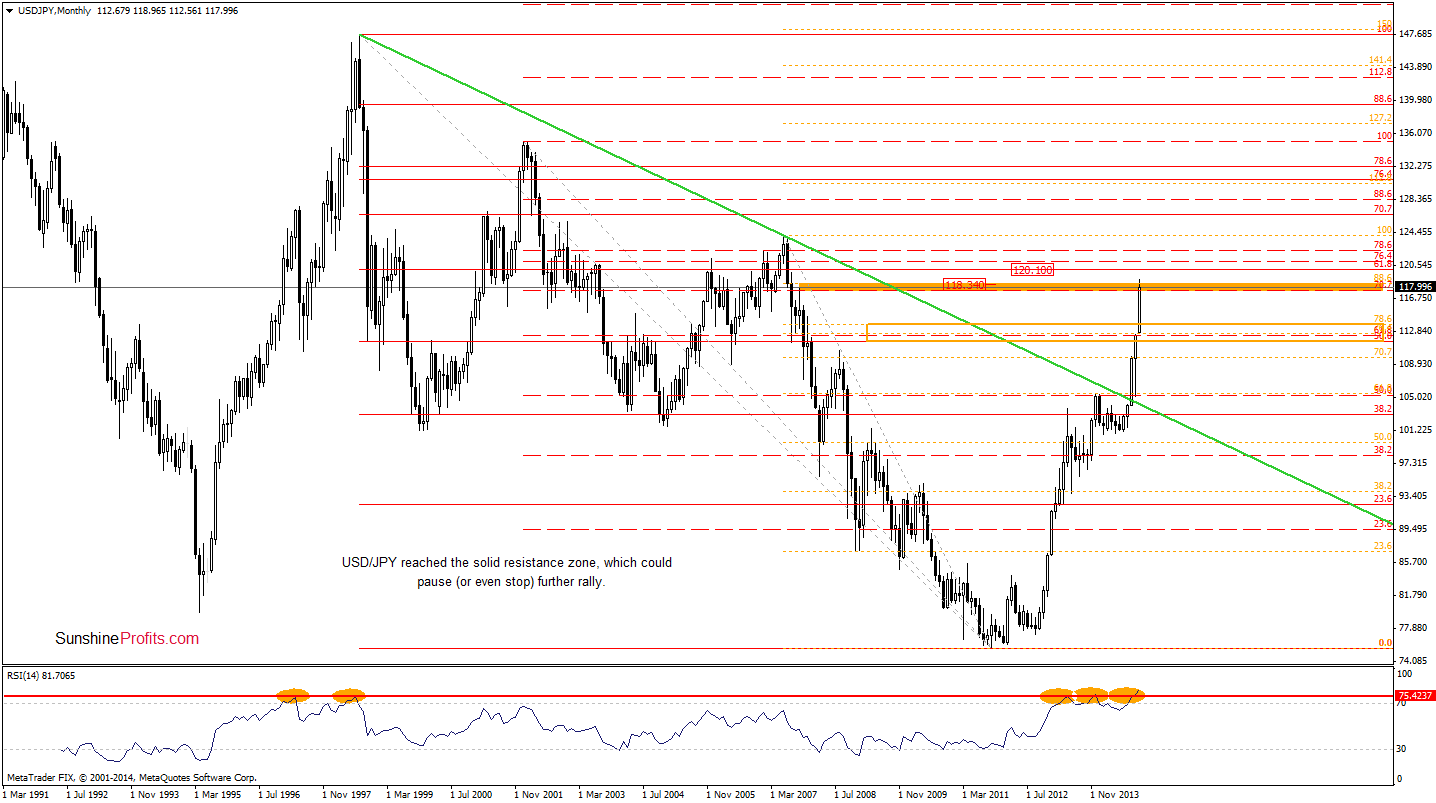
(…) the exchange rate climbed to the strong resistance zone created by the 261.8% Fibonacci extension (marked on the daily chart), the 200% Fibonacci price projection (seen on the weekly chart), the 70.7% Fibonacci retracement (based on the 2002-2011 decline) and 88.6% retracement (based on the 2007-2011 move). In our opinion, the combination of these four resistance levels is strong enough to (at least) pause further improvement and trigger a correction in the near future. Please note that this scenario is currently reinforced by the position of the indicators: the daily RSI climbed to its highest level since Sep (while the monthly indicator hasn’t been so high since 1992) and there are negative divergences between the daily (and also weekly) CCI, the Stochastic Oscillator and the exchange rate.
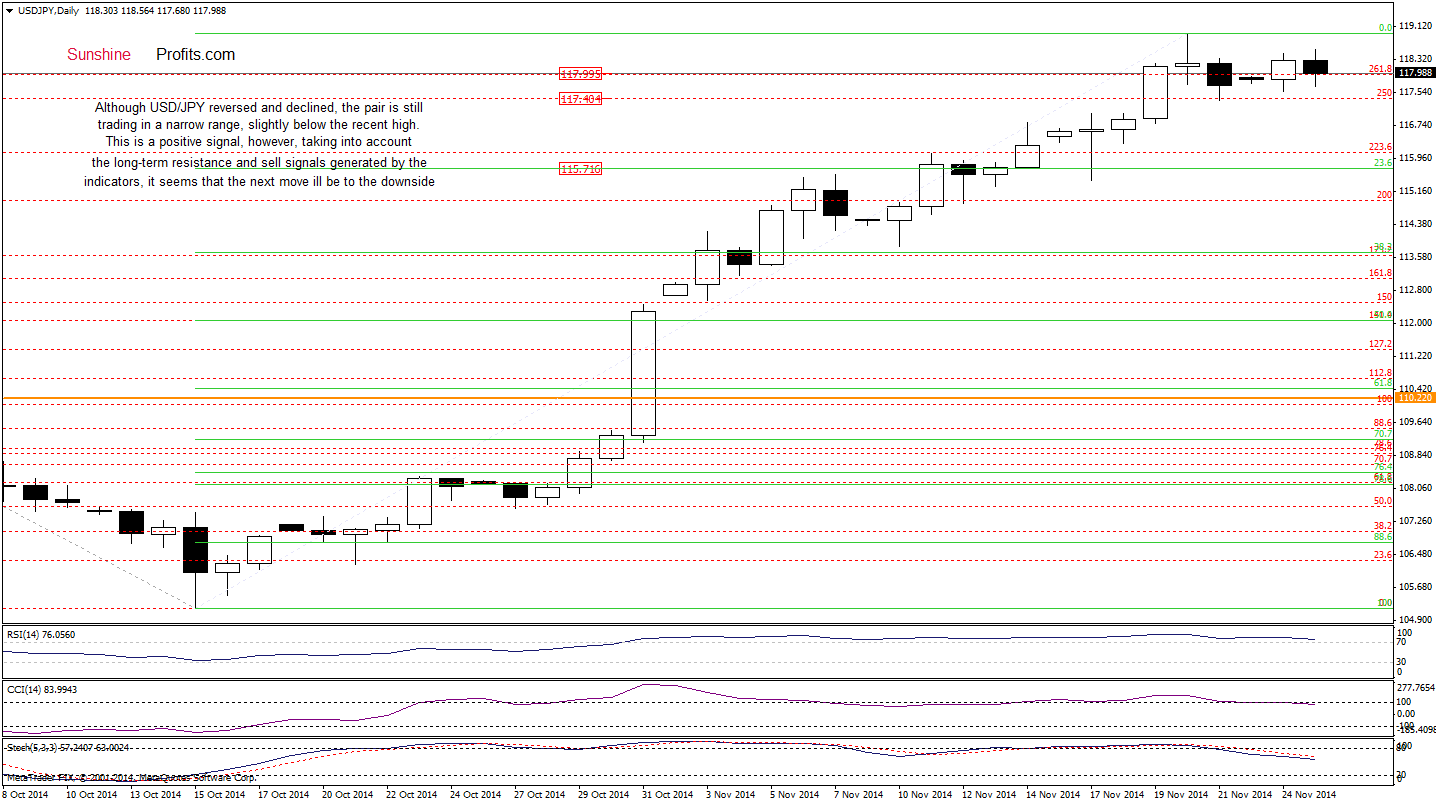
Looking at the daily chart, we see that although USD/JPY gave up some gains, the pair is still trading in a narrow range, slightly below the recent high. This is a positive signal, however, taking into account the above-mentioned strong resistance zone (marked with orange on the weekly chart) and sell signals generated by the daily indicators, we still think that the next move will be to the downside. If this is the case, and the pair drops below 117.34 (Friday’s low), we’ll likely see further deterioration and a drop to around 115.72, where the 23.6% Fibonacci retracement based on the entire Oct-Nov rally is (additionally, in this area the size of the downswing will correspond to the current consolidation marked with blue).
Very short-term outlook: mixed with bearish bias
Short-term outlook: mixed with bearish bias
MT outlook: bullish
LT outlook: bullish
Trading position (short-term; our opinion): No positions are justified from the risk/reward perspective at the moment. However, we’ll consider opening short positions if we see a confirmation of the above. We will keep you informed should anything change, or should we see a confirmation/invalidation of the above.
USD/CHF
Quoting our Forex Trading Alert posted on Friday:
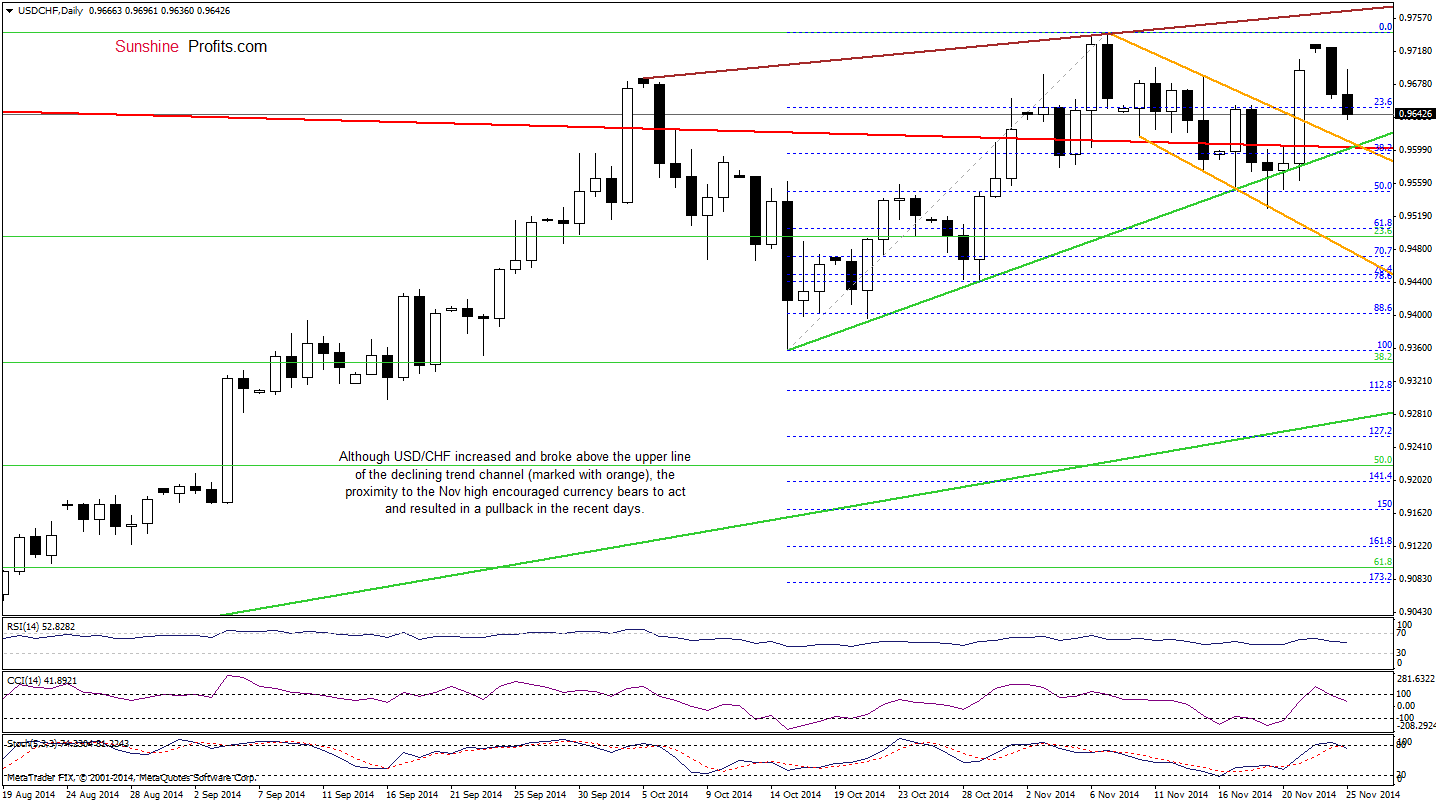
(…) USD/CHF climbed above the upper line of the declining trend channel (marked with orange), which is another strong bullish signal that suggests further improvement and an increase to around the Nov high of 0.9740 (in this area the size of the upswing will correspond to the height of the trend channel). Please note that the current position of the indicators also supports the bullish case (buy signal remain in place).
The daily chart shows that the situation developed in line with the above-mentioned scenario as USD/CHF climbed to 0.9717. Despite this increase, the proximity to the 2014 high encouraged currency bears to act and resulted in a correction in the following days. Although the pair erased over 40% of the recent rally, USD/CHF still remains above the strong support zone created by the previously-broken upper line of the declining trend channel, the long-term red line and the green support line, which successfully stopped further deterioration last week. In our opinion, as long as this area is in play, another attempt to move higher is likely. Nevertheless, taking into account the current position of the indicators (the CCI and Stochastic Oscillator generated sell signals), it seems that currency bears will test the strength of this major support in the coming days.
Very short-term outlook: mixed with bearish bias
Short-term outlook: mixed
MT outlook: mixed
LT outlook: bearish
Trading position (short-term; our opinion): No positions are justified from the risk/reward perspective at the moment. We will keep you informed should anything change, or should we see a confirmation/invalidation of the above.
Thank you.
Nadia Simmons
Forex & Oil Trading Strategist
Przemyslaw Radomski, CFA
Founder, Editor-in-chief
Gold & Silver Trading Alerts
Forex Trading Alerts
Oil Investment Updates
Oil Trading Alerts
