
Forex Trading Alert originally sent to subscribers on October 23, 2014, 1:38 PM.
Earlier today, the Department of Labor showed that the four-week average of the initial jobless claims fell to the lowest level since May 2000. In response, the U.S. dollar moved higher and climbed to a two week high against the weaker yen. How did this move change the very short-term picture?
In our opinion the following forex trading positions are justified - summary:
- EUR/USD: none
- GBP/USD: none
- USD/JPY: none
- USD/CAD: none
- USD/CHF: none
- AUD/USD: long (stop-loss order: 0.8587; initial price target: 0.8943)
EUR/USD
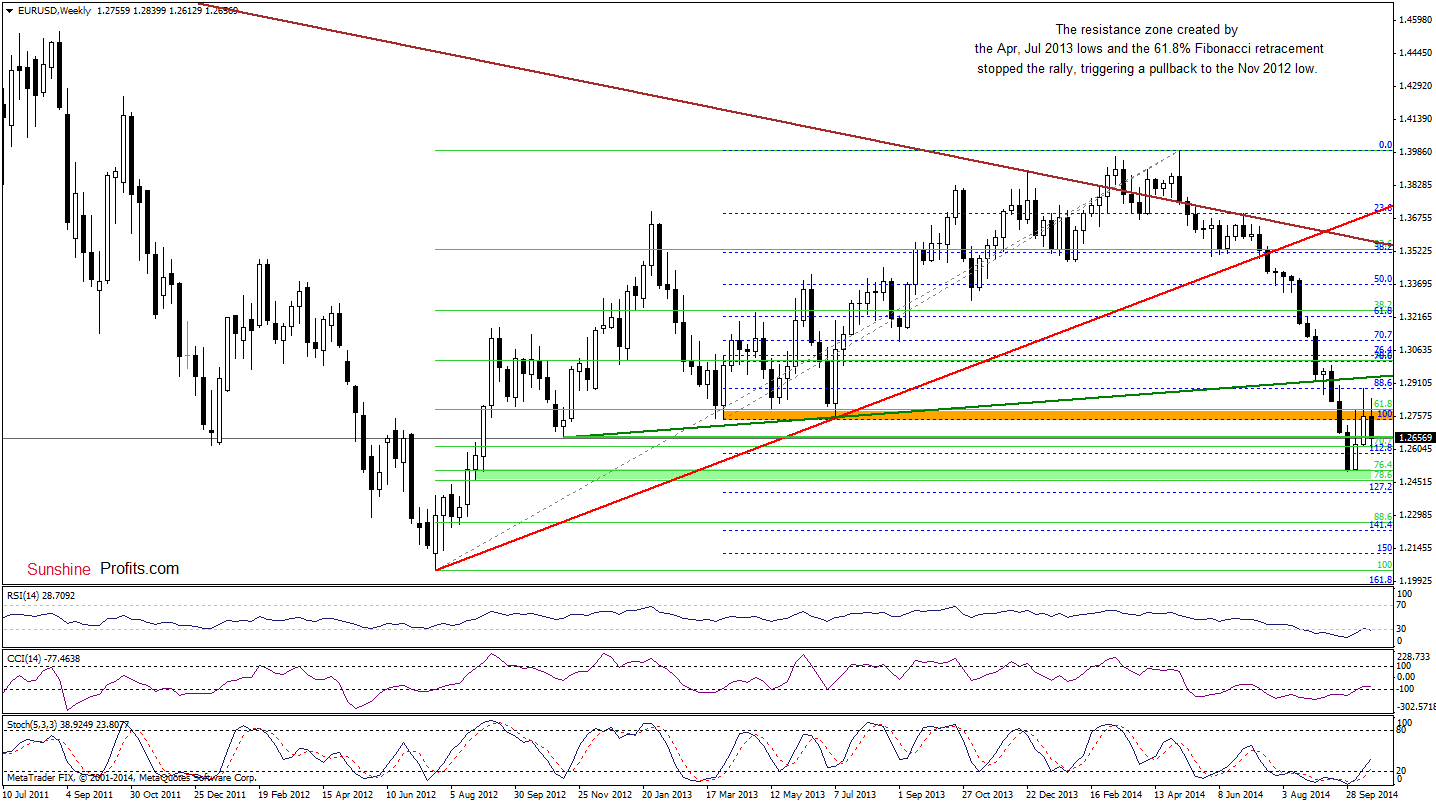
The situation in the medium term has deteriorated slightly as the resistance zone created by the Apr and Jul 2013 lows and 61.8% Fibonacci retracement triggered a pullback, pushing EUR/USD to the Nov 2012 low. If this support is broken, it seems that the exchange rate will test the strength of the recent lows.
Are there any positive signs in the very short term that could stop currency bears? Let’s take a closer look at the daily chart and find out.
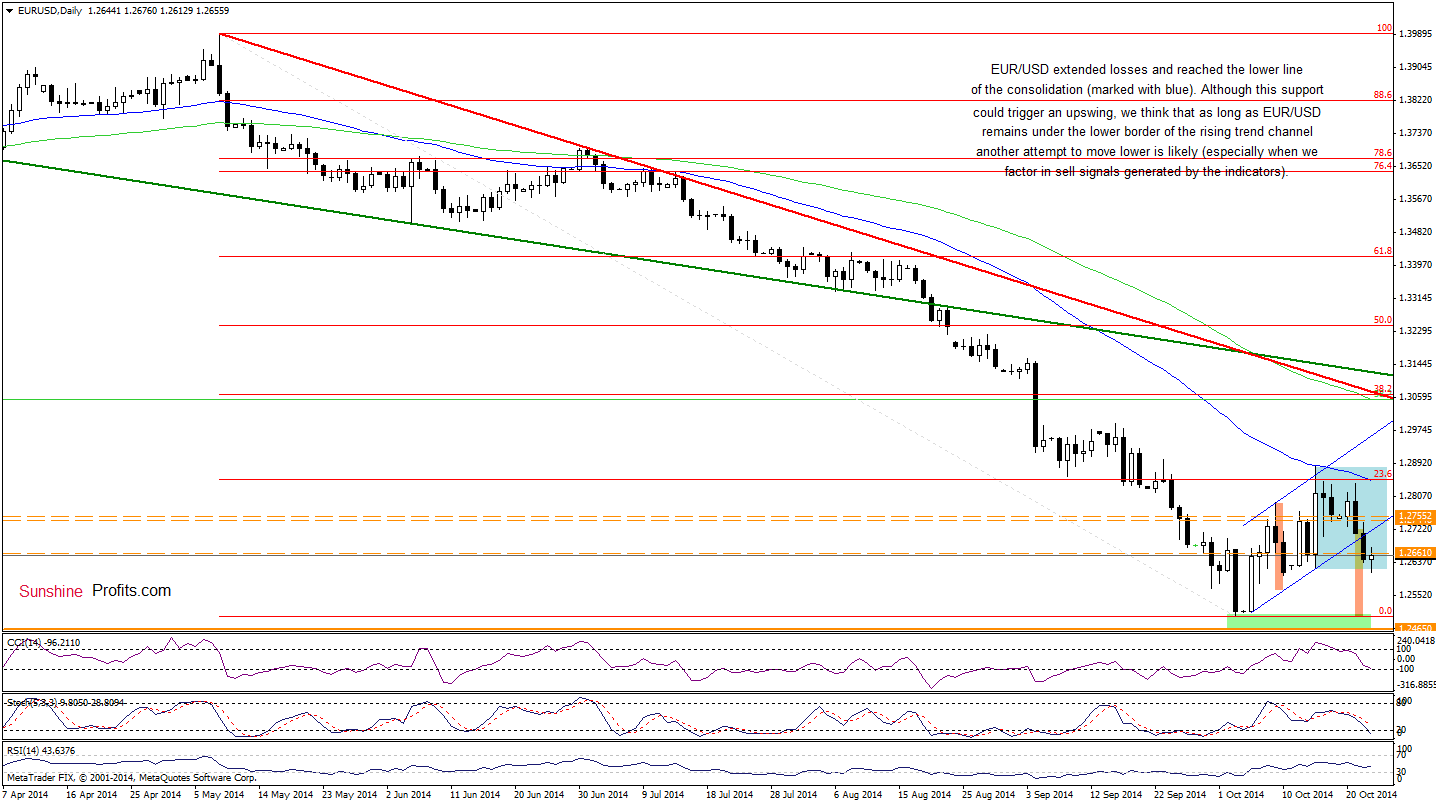
From this perspective, we see that the pair extended losses below the lower border of the rising trend channel earlier today. With this downswing, the pair reached the bottom line of the consolidation (marked with blue), which triggered a small upswing. Although we could see further improvement, we think that as long as EUR/USD is trading under the previously-broken lower line of the trend channel, another attempt to move lower is likely. This scenario is currently reinforced by sell signals generated by the CCI and Stochastic Oscillator and the fact that the exchange rate remains below the Nov 2012 low (at the moment when these words are written). Please note that if the pair closes the day under the lower line of the consolidation, we’ll likely see a test of the strength of the recent lows (as a reminder, in this area the size of the downward move will correspond to the height of the trend channel).
Very short-term outlook: bearish
Short-term outlook: mixed with bearish bias
MT outlook: mixed
LT outlook: bearish
Trading position (short-term): In our opinion, no positions are justified from the risk/reward perspective at the moment. We will consider re-enter long positions at lower levels . We will keep you informed should anything change, or should we see a confirmation/invalidation of the above.
USD/JPY
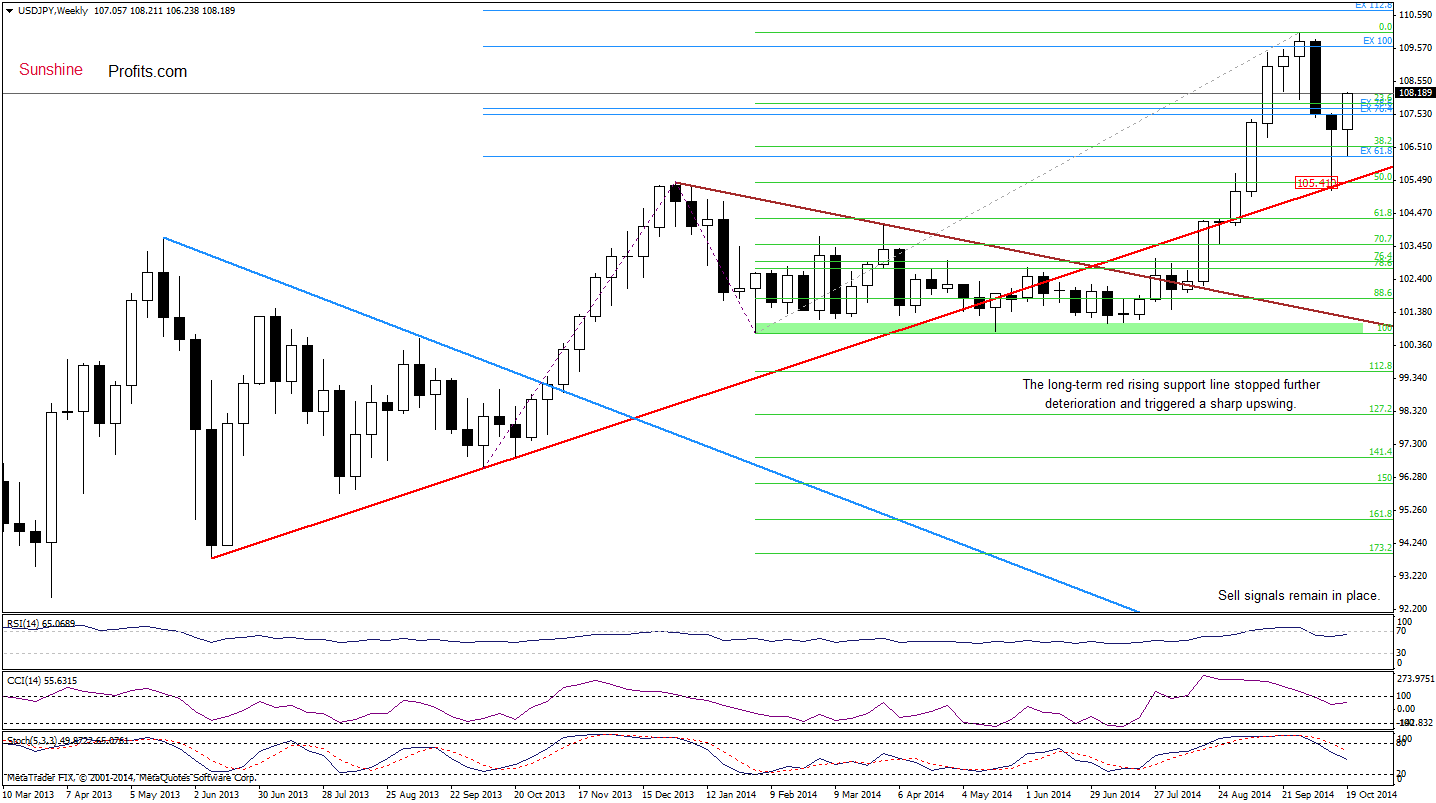
The situation in the medium term has improved as USD/JPY bounced off the long-term rising support line. How this move affected the very short-term picture?
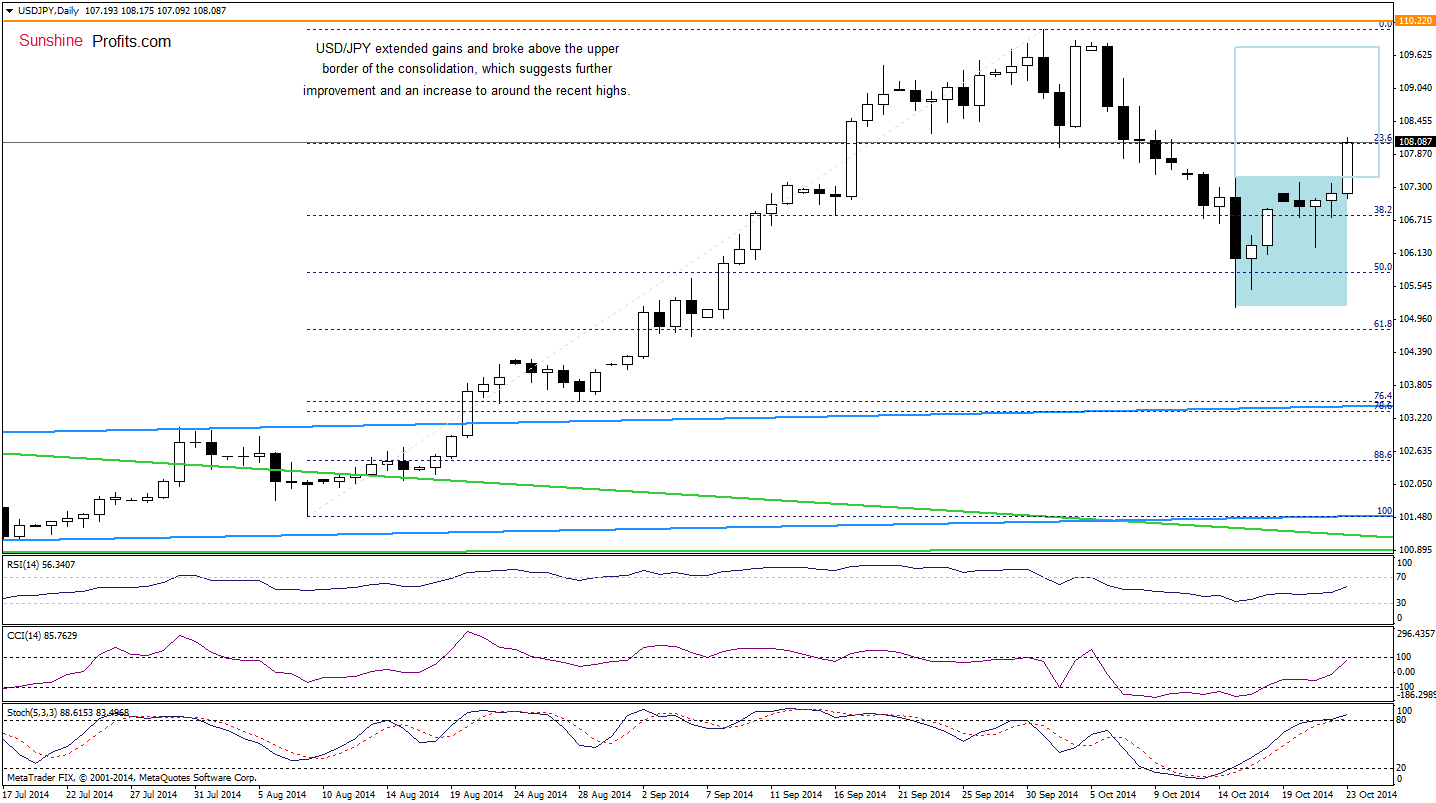
The first thing that catches the eye on the above chart is a breakout above the upper line of the consolidation (marked with blue). This is a bullish signal that suggests further improvement. If this is the case, we could see an increase to around 109.75, where the size of the upward move will correspond to the height of the formation. Please note that although the Stochastic Oscillator climbed above the level of 80, we think that as long as there are no sell signals further improvement is more likely than not (therefore, taking profits off the table and closing short positions was definitely a good idea).
Very short-term outlook: bullish
Short-term outlook: mixed with bullish bias
MT outlook: mixed
LT outlook: bearish
Trading position (short-term; our opinion): No positions are justified from the risk/reward perspective at the moment. We will keep you informed should anything change, or should we see a confirmation/invalidation of the above.
USD/CAD
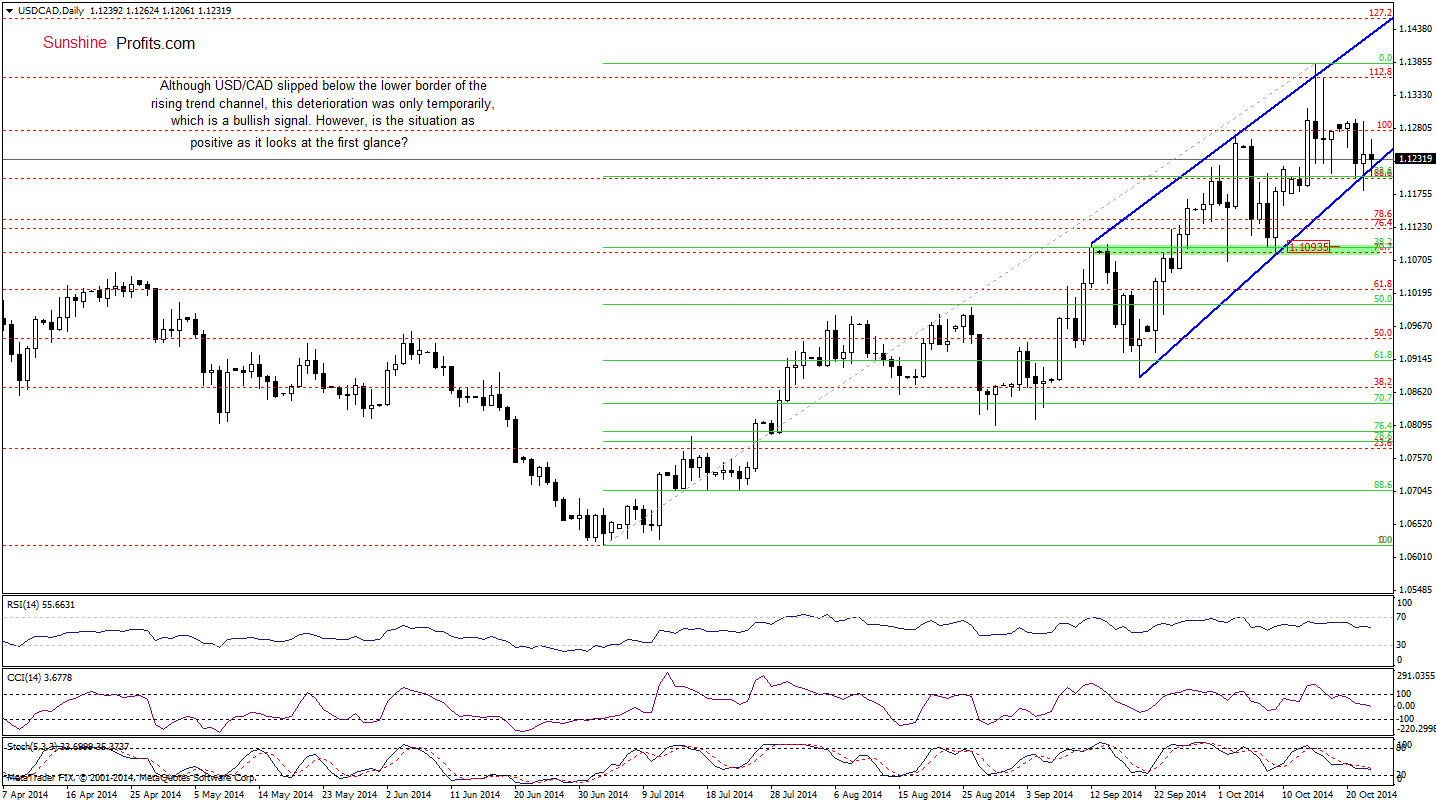
Looking at the daily chart, we see that USD/CAD slipped below the lower border of the rising trend channel yesterday and earlier today, but these breakdowns were invalidated very quickly. Although this is a bullish signal, we should keep in mind that sell signals generated by the daily indicators are still in play. Additionally, a more disturbing picture emerges from the weekly chart. Let’s take a look.
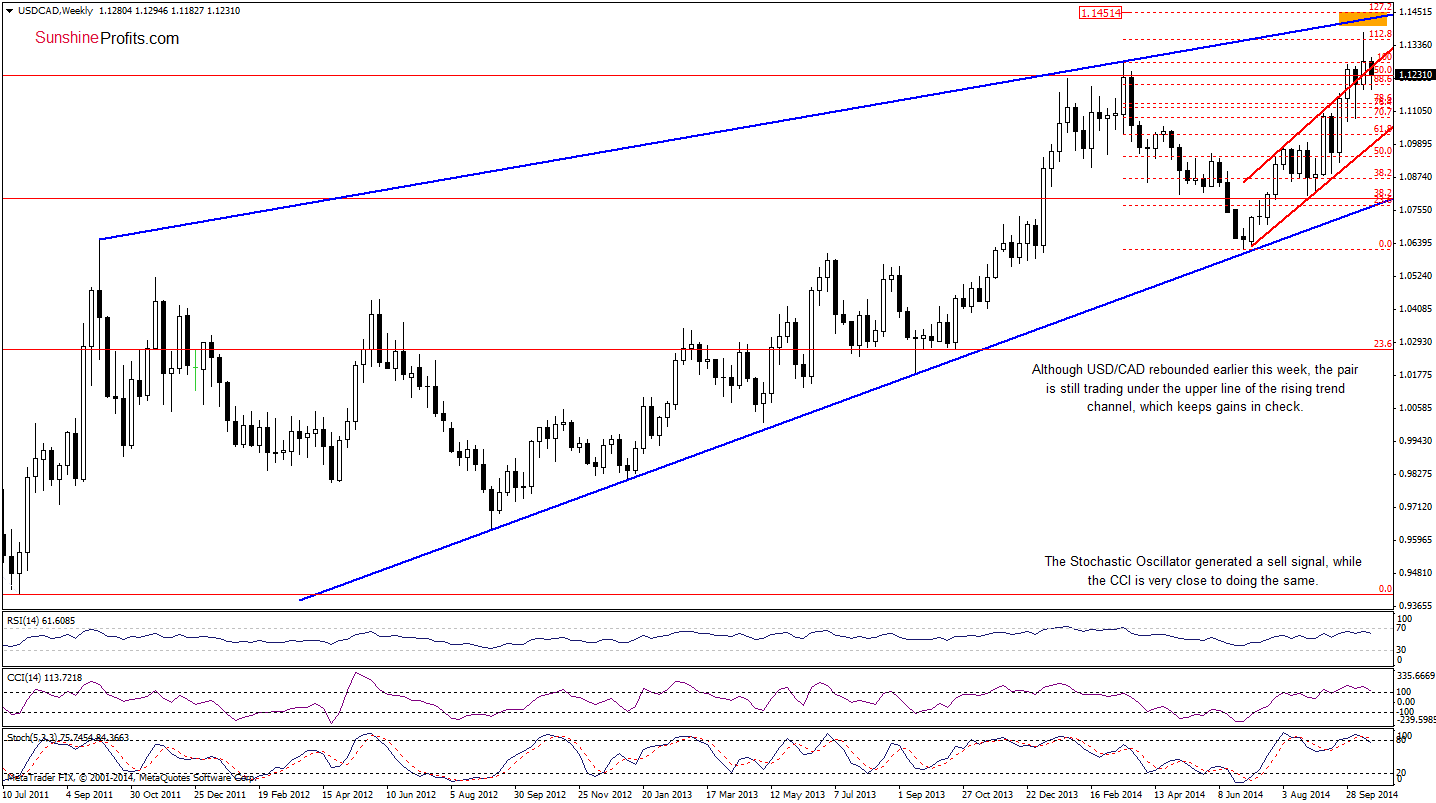
From this perspective, we see that although USD/CAD rebounded earlier this week, the pair is still trading under the previously-broken upper line of the rising trend channel. In our opinion, if currency bulls do not manage to push the exchange rate above this key resistance line, the current upswing will be nothing more than a verification of the breakdown. If this is the case, it will be a bearish signal, which will trigger further deterioration. How low could USD/CAD go? We think that the best answer to this question will be our last commentary on this currency pair:
(…) If (…) the exchange rate drops below the last week’s low, the correction will likely accelerate and the initial downside target would be around 1.1070-1.1096
(…) taking into account the medium-term picture and sell signals generated by the daily indicators, it seems that a breakdown is just a matter of time. If this is the case, we would see a drop to around 1.10.93, where the 38.2% Fibonacci retracement (based on the entire Jul-Oct rally) and the medium-term support zone are.
Very short-term outlook: mixed with bearish bias
Short-term outlook: mixed with bearish bias
MT outlook: mixed with bearish bias
LT outlook: bearish
Trading position (short-term; our opinion): No positions are justified from the risk/reward perspective at the moment. We will keep you informed should anything change, or should we see a confirmation/invalidation of the above.
Thank you.
Nadia Simmons
Forex & Oil Trading Strategist
Przemyslaw Radomski, CFA
Founder, Editor-in-chief
Gold & Silver Trading Alerts
Forex Trading Alerts
Oil Investment Updates
Oil Trading Alerts
