
Forex Trading Alert originally sent to subscribers on October 21, 2014, 3:08 PM.
Earlier today, the National Association of Realtors showed that sales of previously owned homes climbed 2.4% from a month earlier to a seasonally adjusted annual rate of 5.17 million in September. These solid numbers supported the greenback and pushed the USD/CAD pair to the important short-term support. Will it be strong enough to push the exchange rate higher?
In our opinion the following forex trading positions are justified - summary:
- EUR/USD: long (stop-loss order: 1.2560; initial price target: 1.3072)
- GBP/USD: none
- USD/JPY: none
- USD/CAD: none
- USD/CHF: short (stop-loss order: 0.9711; initial price target: 0.9332)
- AUD/USD: long (stop-loss order: 0.8587; initial price target: 0.8943)
EUR/USD
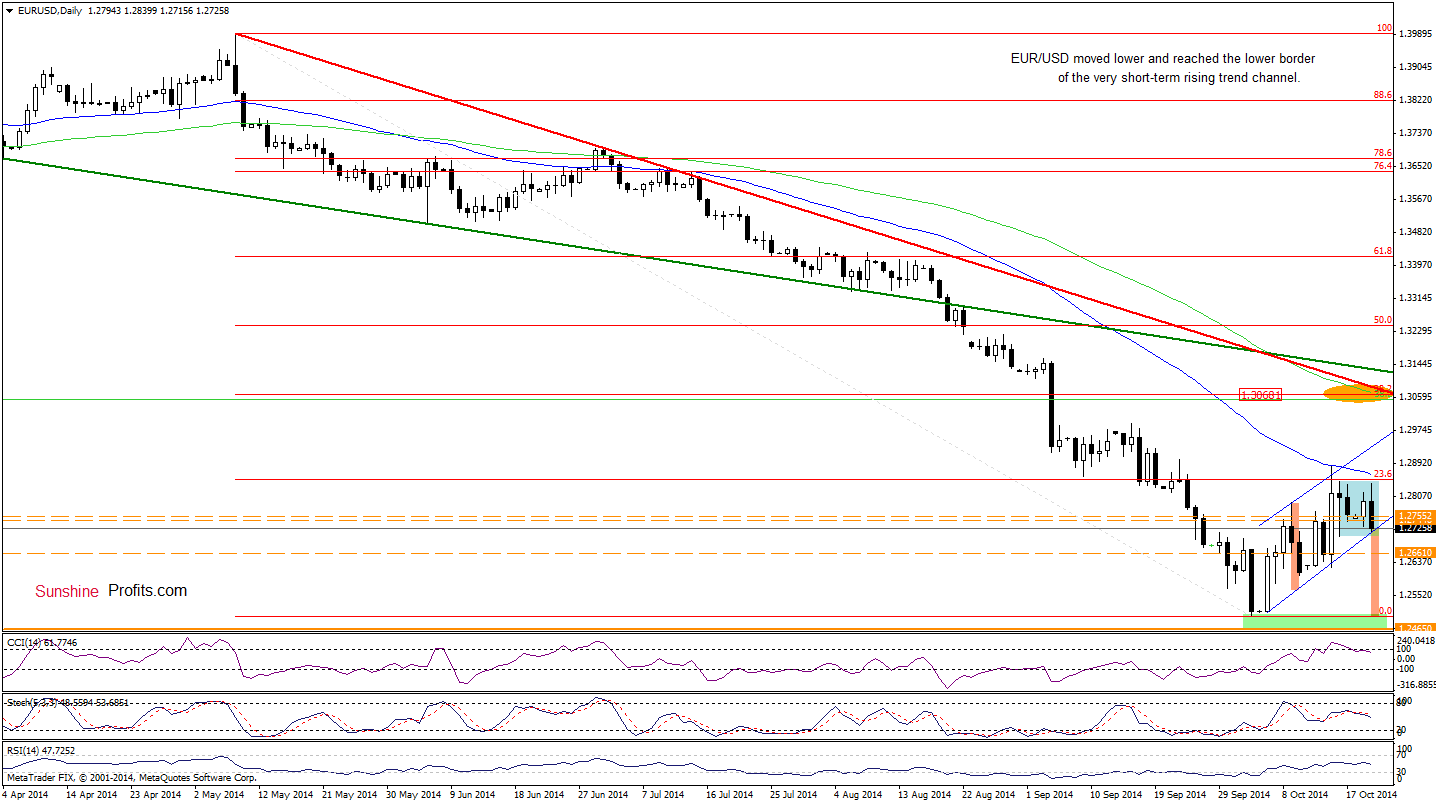
The situation in the medium term hasn’t changed much as EUR/USD is trading around the green support/resistance zone. Today, we’ll take a closer look at the very short-term changes.
On Thursday, we wrote the following:
(…) the pair invalidated the breakout above the 23.6% Fibonacci retracement and the upper line of the very short-term rising trend channel, which could trigger a pullback in the coming day to the Apr and Jul 2013 lows or even to the lower border of the formation (currently around 1.2641).
Looking at the daily chart, we see that the situation developed in line with the above-mentioned scenario as EUR/USD dropped below the Apr and Jul 2013 lows, reaching its downside target. At this point, it’s worth noting that slightly below this line is also the lower border of the consolidation (marked with blue). Therefore, we may see a rebound from here in the coming days. Nevertheless, taking into account sell signals generated by the CCI and Stochastic Oscillator, we should also consider a bearish scenario. In this case, a potential breakdown could trigger a test of the strength of the recent lows.
Very short-term outlook: bullish
Short-term outlook: mixed with bullish bias
MT outlook: mixed
LT outlook: bearish
Trading position (short-term; in our opinion): Long positions with a stop-loss order at 1.2560 are justified from the risk/reward perspective at the moment. We will keep you informed should anything change, or should we see a confirmation/invalidation of the above.
USD/JPY
Quoting our last commentary on this currency pair posted on Oct 15:
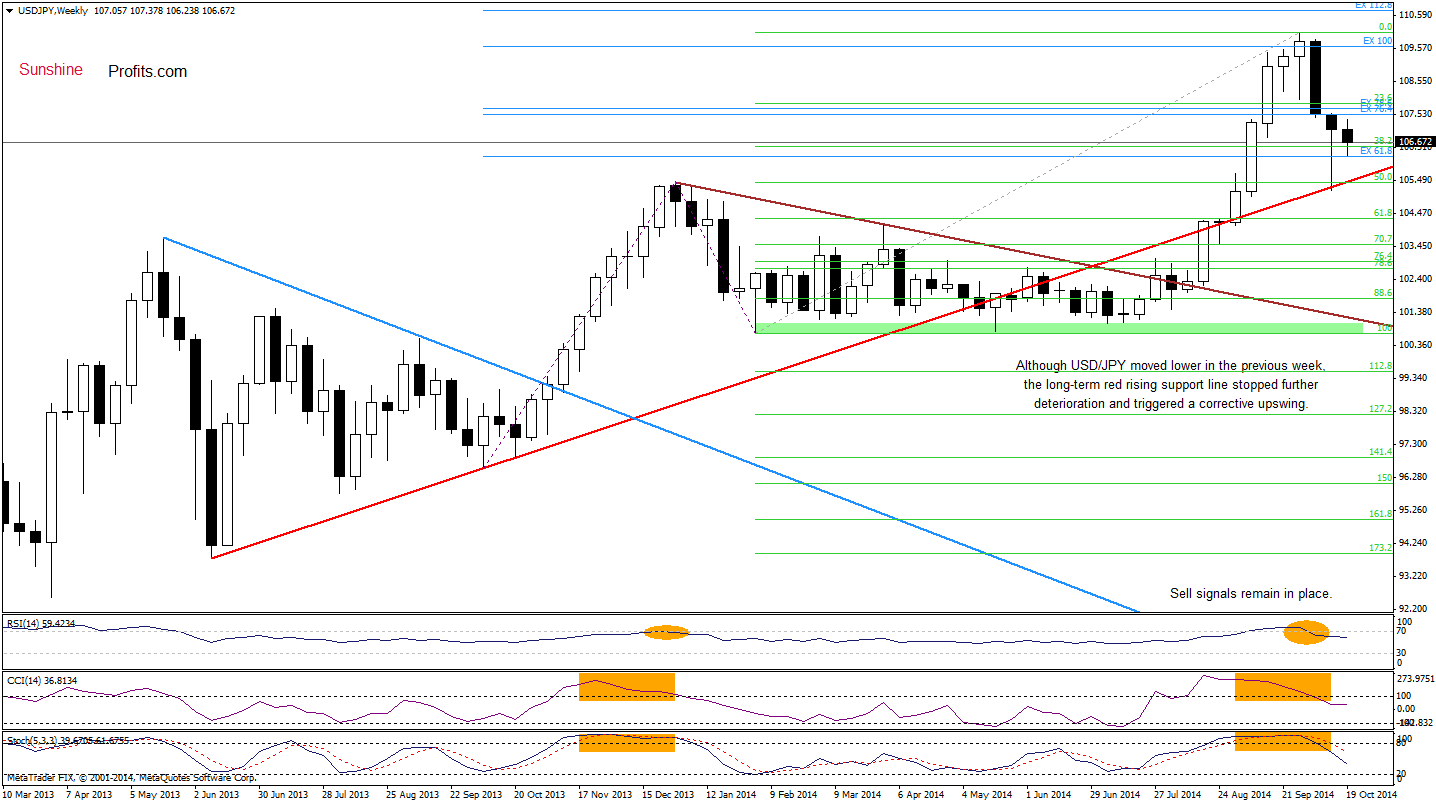
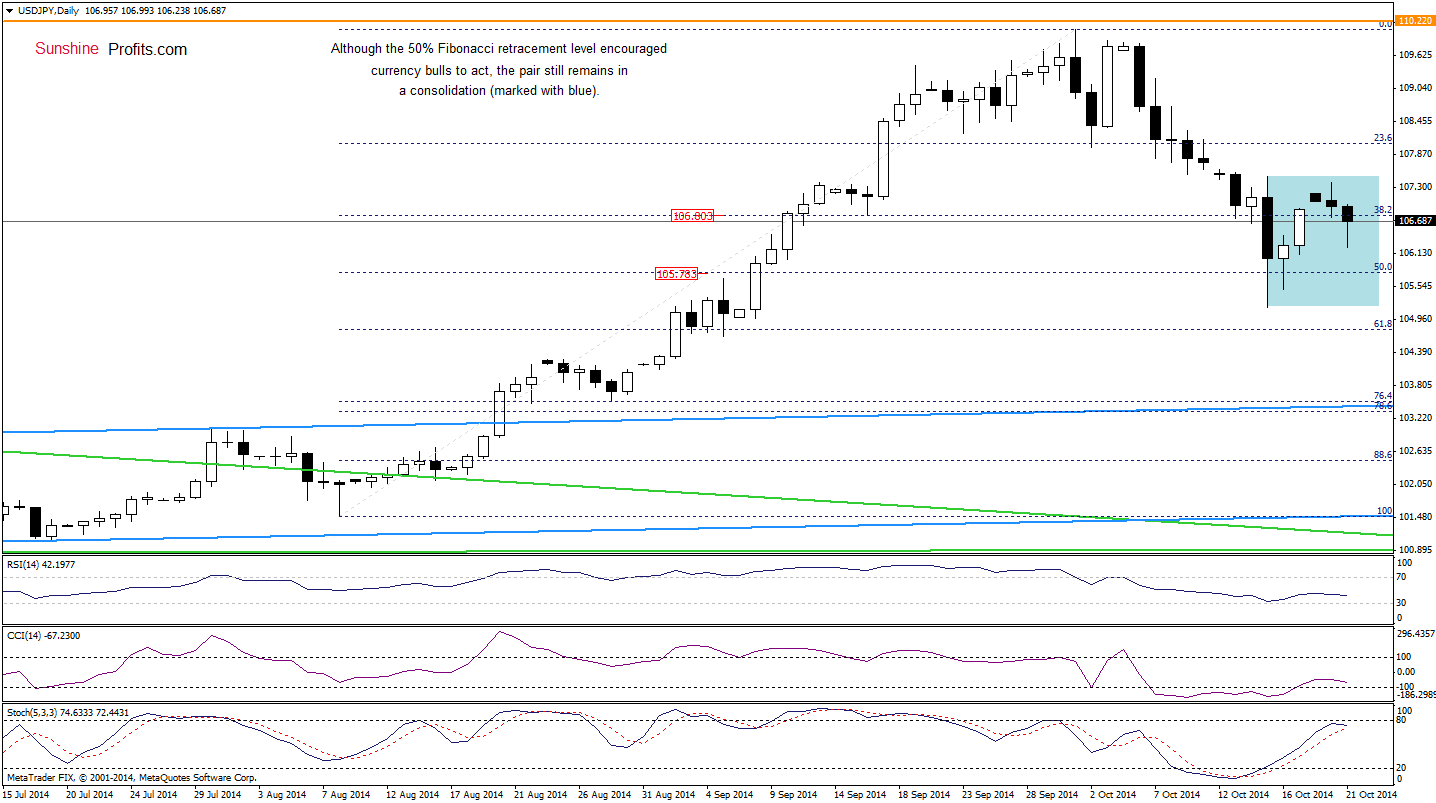
(…) the exchange rate reached the previously-broken long-term support line (marked with red) and the support level based on the Dec 2013 high. Additionally, when we compare the size of thecurrent correction to the one that we saw at the beginning of the year, we clearly see that they are identical. Taking these facts into account, and combining it with the 50% Fibonacci retracement and the position of the daily indicators, it seems that we could see a rebound from here in the coming week.
As you see on the above charts, currency bulls took their chance and pushed the exchange highr as we expected (therefore, closing short positions and taking profits off the table on Oct 15 was a good decision). Despite this improvement, USD/JPY is still trading in a consolidation (marked with blue on the daily chart) above the long-term red support line. Although sell signals generated by the weekly indicators are still in play, we think that as long as there is no breakdown below this key support line (currently around 105.41) another sizable downward move is not likely to be seen.
Very short-term outlook: mixed
Short-term outlook: mixed
MT outlook: mixed
LT outlook: bearish
Trading position (short-term; our opinion): No positions are justified from the risk/reward perspective at the moment. We will keep you informed should anything change, or should we see a confirmation/invalidation of the above.
USD/CAD
In our Forex Trading Alert posted on Oct 16, we wrote the following:
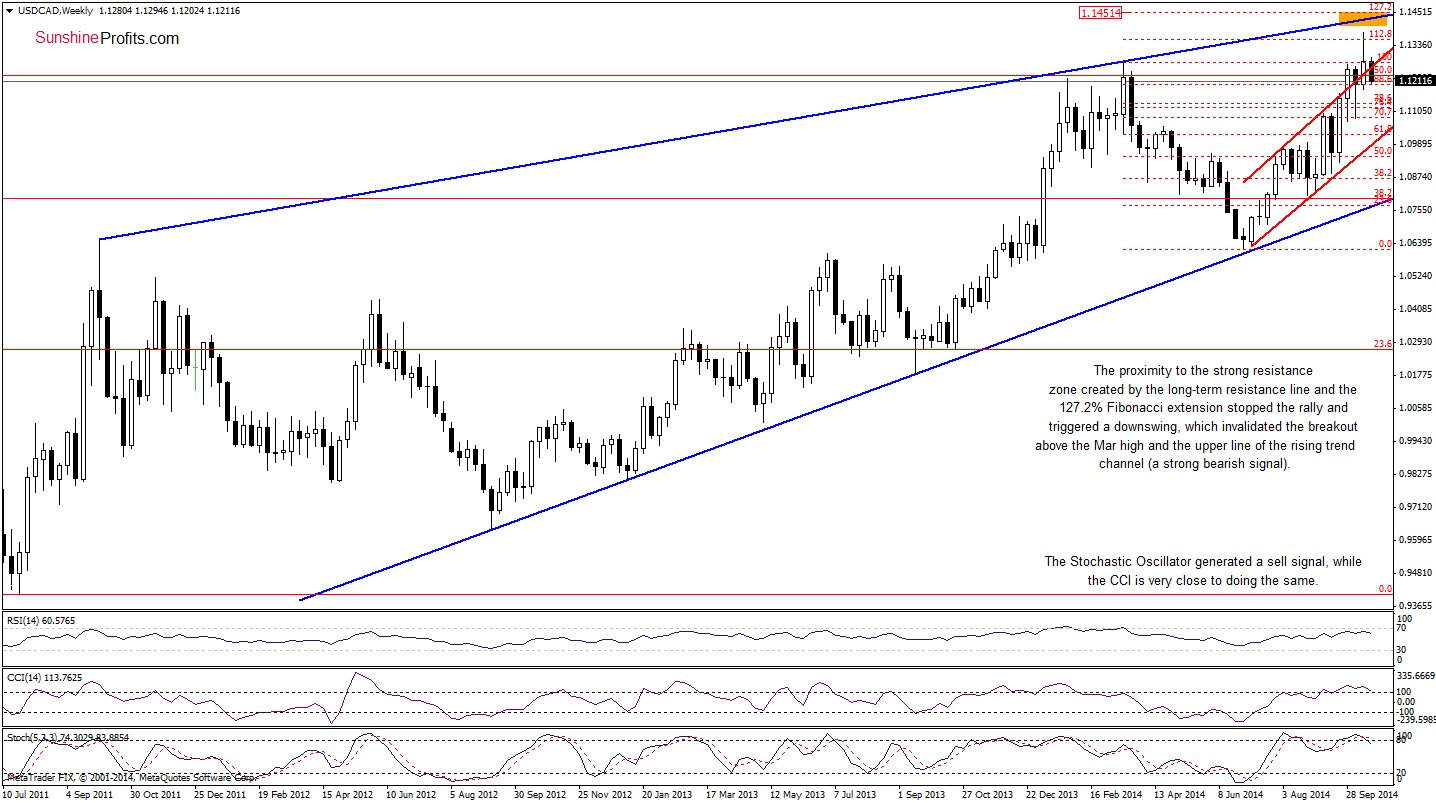
(…) it seems that the space for further gains is limited as the resistance zone created by the long-term blue resistance line and the 127.2% Fibonacci extension is quite close (around 1.1426-1.1451). Additionally, the CCI and Stochastic Oscillator are overbought, which suggests that a pause is just around the corner.
The weekly chart clearly shows that the proximity to the above-mentioned resistance zone was strong enough to stop the rally. As you see, USD/CAD reversed and declined, invalidating earlier breakout above the Mar high and the upper line of the rising trend channel (marked with red). This is a bearish signal that suggests further deterioration – especially when we factor in a sell signal generated by the Stochastic Oscillator (additionally, the CCI is very close to doing the same). If this is the case, and the exchange rate drops below the last week’s low, the correction will likely accelerate and the initial downside target would be around 1.1070-1.1096, where the nearest support zone is.
Are there any technical factors in the very short-term that could hinder the realization of this scenario? Let’s check.
In our last commentary on this currency pair, we wrote:
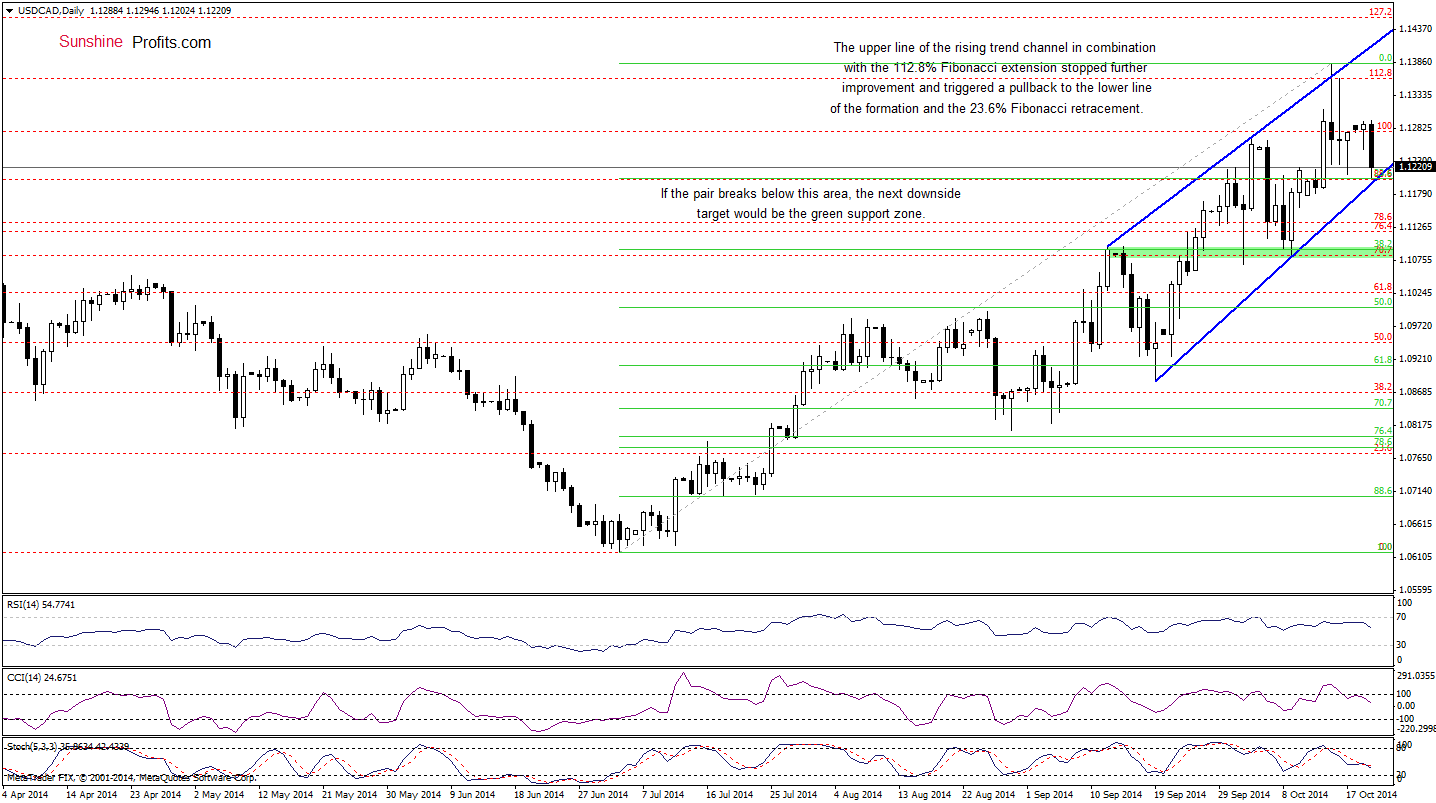
(…) the exchange rate is trading in the rising trend channel. Although the pair climbed above the recent highs, the upper line of the formation in combination with the 112.8% Fibonacci extension stopped further improvement and triggered a pullback yesterday. (…) it seems that as long as this resistance zone is in play, the space for further rally is limited. If the blue resistance line encourages currency bears to act, we would see a drop to the lower border of the formation (currently around 1.1150).
Looking at the daily chart, we see that the situation develiped in line with the above-mentioned scenario as USD/CAD reached our downside target. What’s next? As you see, the recent downward move took the pair to the 23.6% Fibonacci retracement, which together with the lower line of the trend channel creates a support area. If it withstands the selling pressure, we could see a rebound from here to the recent high or even to the upper line of the formation. However, taking into account the medium-term picture and sell signals generated by the daily indicators, it seems that a breakdown is just a matter of time. If this is the case, we would see a drop to around 1.10.93, where the 38.2% Fibonacci retracement (based on the entire Jul-Oct rally) and the medium-term support zone are.
Very short-term outlook: mixed with bearish bias
Short-term outlook: mixed with bearish bias
MT outlook: mixed with bearish bias
LT outlook: bearish
Trading position (short-term; our opinion): No positions are justified from the risk/reward perspective at the moment. We will keep you informed should anything change, or should we see a confirmation/invalidation of the above.
Thank you.
Nadia Simmons
Forex & Oil Trading Strategist
Przemyslaw Radomski, CFA
Founder, Editor-in-chief
Gold & Silver Trading Alerts
Forex Trading Alerts
Oil Investment Updates
Oil Trading Alerts
