
Forex Trading Alert originally sent to subscribers on October 16, 2014, 8:43 AM.
Although the U.S. dollar moved lower against most of major currency pairs after disappointing economic data yesterday, we didn’t notice such price action in the case of the USD/CAD. Therefore, we decided to take a closer look at USD/CAD in today’s Forex Trading Alert. Will yesterday’s increase trigger further rally?
In our opinion the following forex trading positions are justified - summary:
- EUR/USD: long (stop-loss order: 1.2560; initial price target: 1.3072)
- GBP/USD: none
- USD/JPY: none
- USD/CAD: none
- USD/CHF: short (stop-loss order: 0.9711; initial price target: 0.9332)
- AUD/USD: long (stop-loss order: 0.8587; initial price target: 0.8943)
EUR/USD
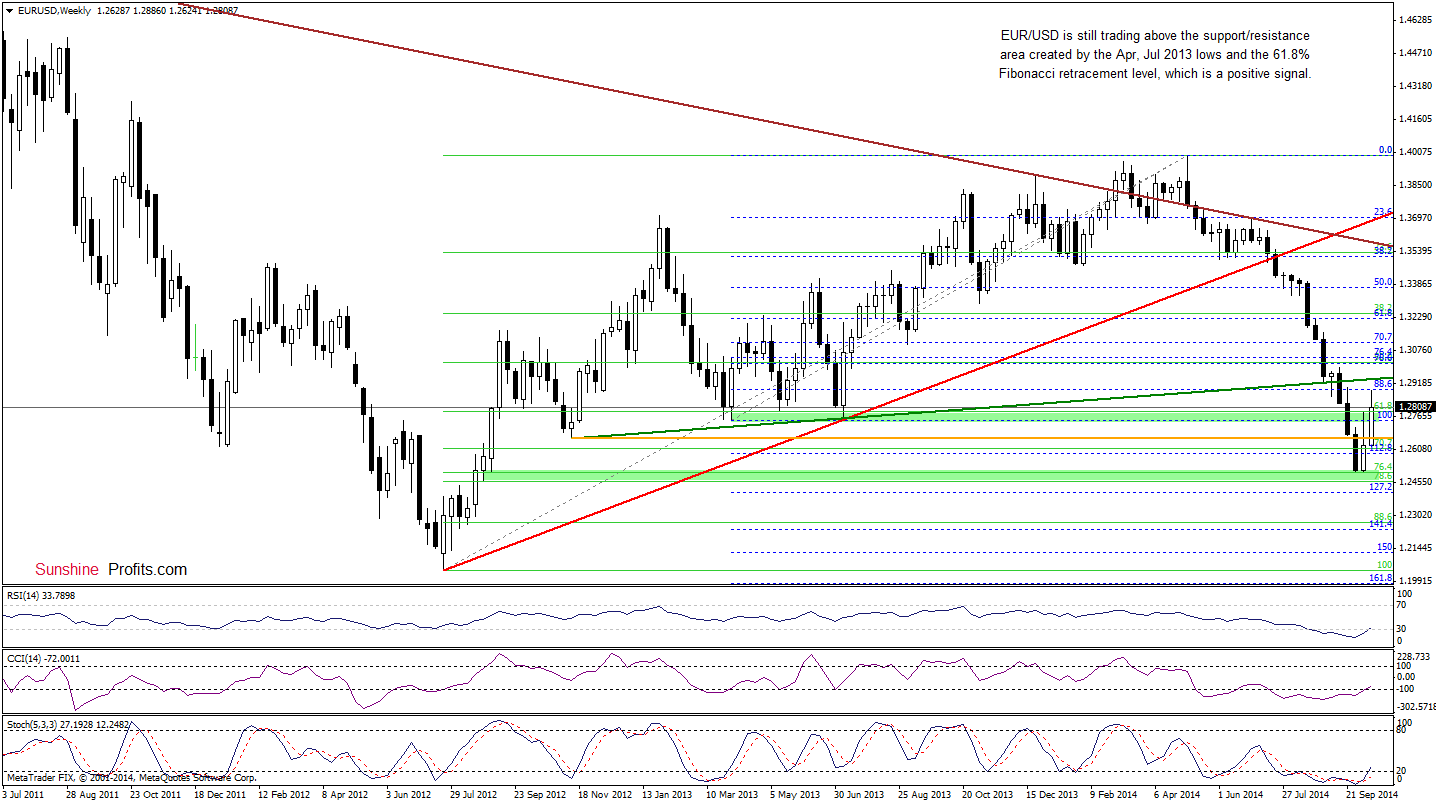
The situation in the medium term hasn’t changed much as EUR/USD is still trading above the support/resistance zone created by the Apr, Jul 2013 lows and the 61.8% Fibonacci retracement level. Therefore, what we wrote yesterday is up-to-date:
(…) This is a positive signal, which will be even more bullish if the pair closes the week above this area. In this case, we’ll see an invalidation of the breakdown, which would likely encourage currency bulls to attack the previously-broken long-term green support/resistance line based on the Nov 2012 and Jul 2013 lows.
Having say that, let’s take a closer look at the very short-term picture.
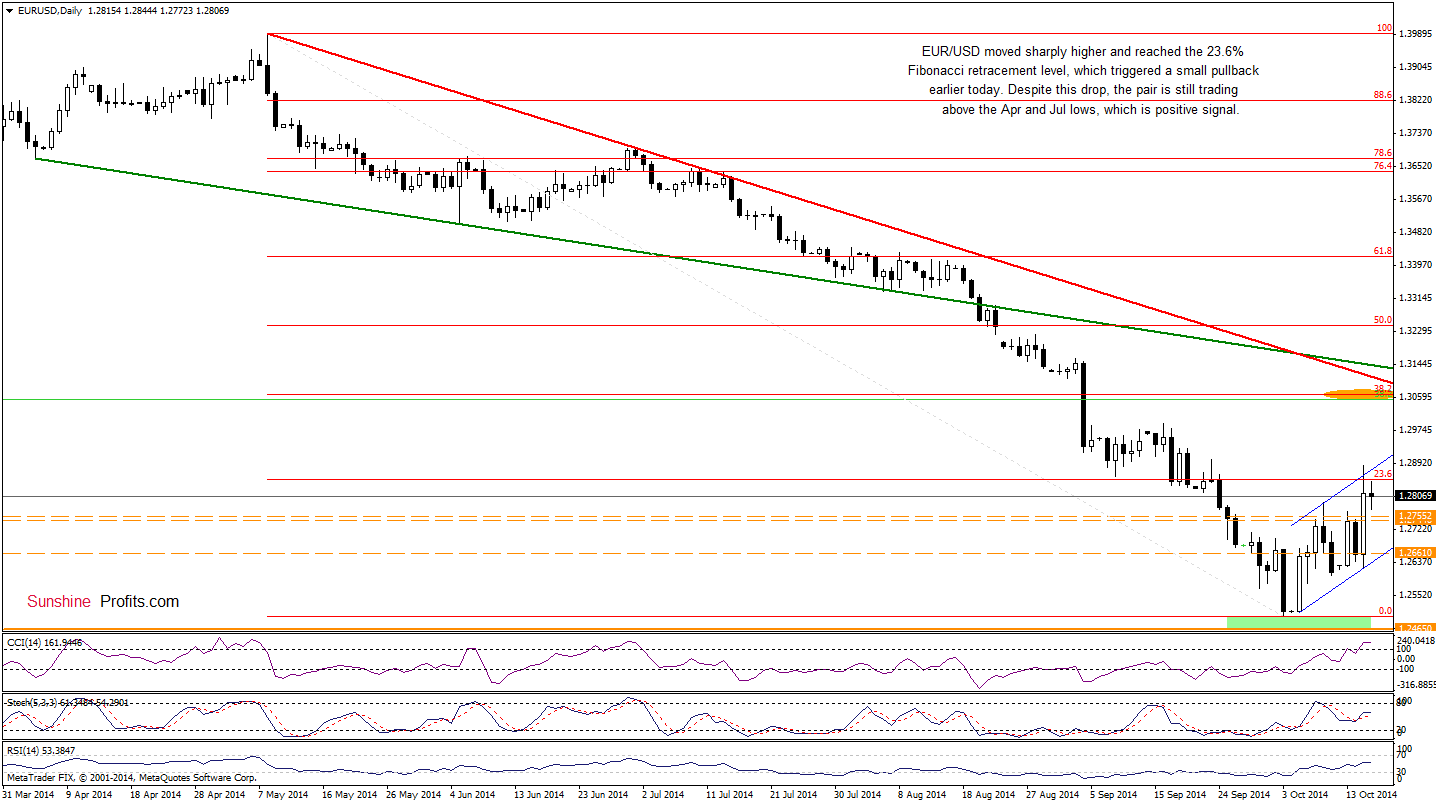
Looking at the daily chart, we see that EUR/USD closed the day above the Apr and Jul 2013 lows, which means an invalidation of the breakdown below these levels. Although this is a positive signal, we should keep in mind that the pair invalidated the breakout above the 23.6% Fibonacci retracement and the upper line of the very short-term rising trend channel, which could trigger a pullback in the coming day to the Apr and Jul 2013 lows or even to the lower border of the formation (currently around 1.2641).
Very short-term outlook: bullish
Short-term outlook:mixed with bullish bias
MT outlook: mixed
LT outlook: bearish
Trading position (short-term; in our opinion): Long positions with a stop-loss order at 1.2560 are justified from the risk/reward perspective at the moment. We will keep you informed should anything change, or should we see a confirmation/invalidation of the above.
USD/CAD
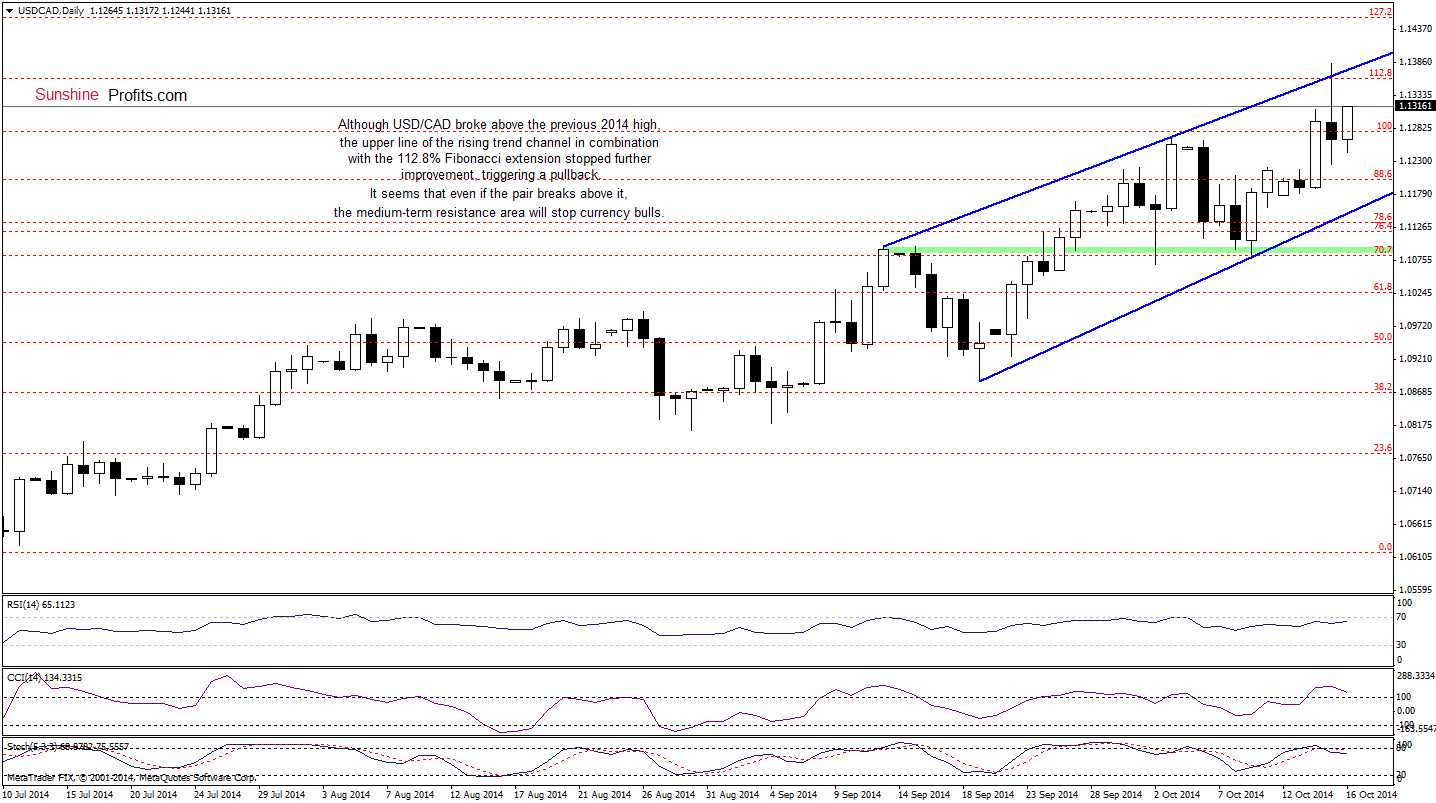
Looking at the daily chart, we see that the exchange rate is trading in the rising trend channel. Although the pair climbed above the recent highs, the upper line of the formation in combination with the 112.8% Fibonacci extension stopped further improvement and triggered a pullback yesterday. As you see, earlier today, USD/CAD rebounded, but it seems that as long as this resistance zone is in play, the space for further rally is limited. If the blue resistance line encourages currency bears to act, we would see a drop to the lower border of the formation (currently around 1.1150). And what could happen if the pair extends gains? Let’s take a look at the weekly chart and try to answer this question.
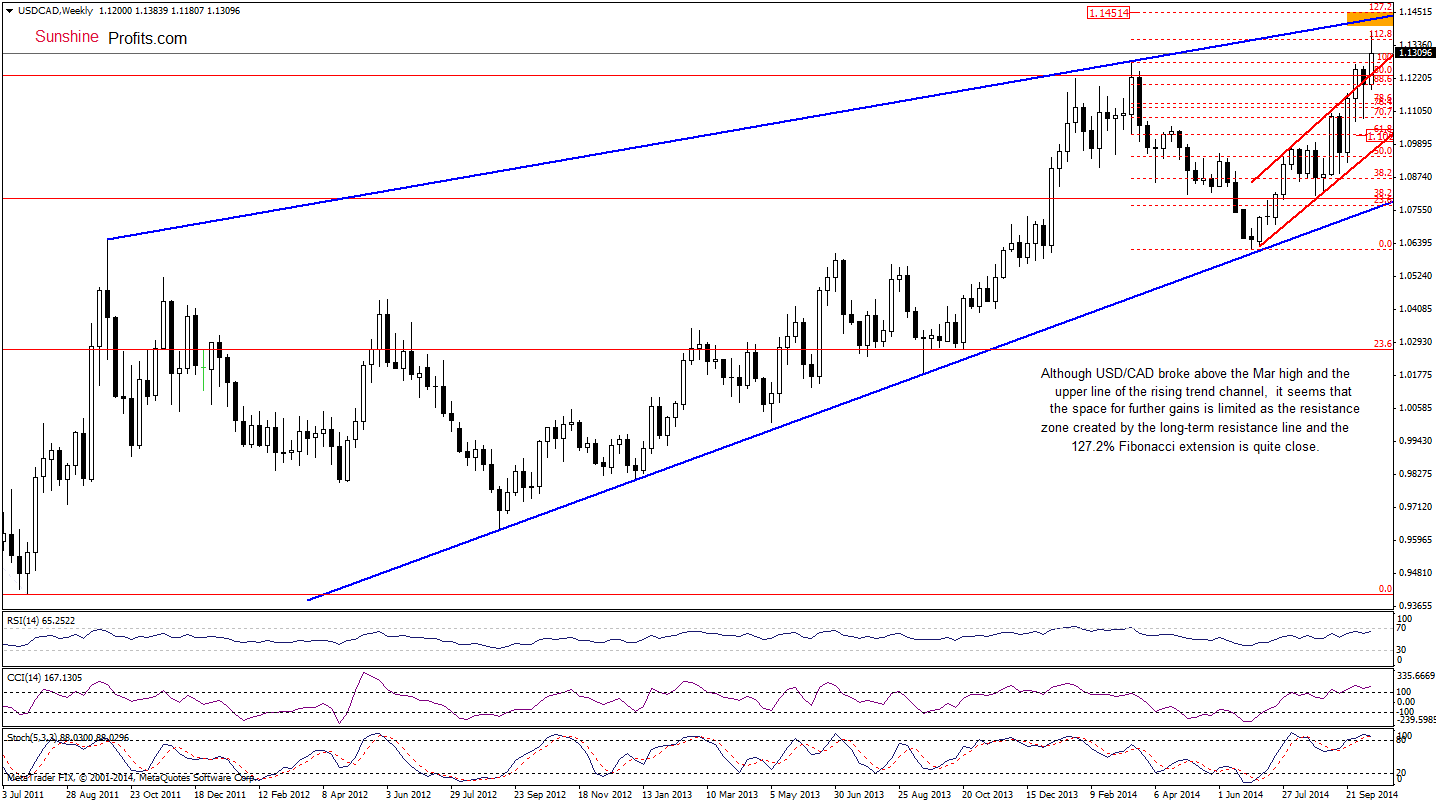
From this perspective, we see that although USD/CAD broke above the Mar high and the upper line of the rising trend channel (marked with red), it seems that the space for further gains is limited as the resistance zone created by the long-term blue resistance line and the 127.2% Fibonacci extension is quite close (around 1.1426-1.1451). Additionally, the CCI and Stochastic Oscillator are overbought, which suggests that a pause is just around the corner.
Very short-term outlook: mixed with bearish bias
Short-term outlook: mixed with bearish bias
MT outlook: mixed with bearish bias
LT outlook: bearish
Trading position (short-term; our opinion): No positions are justified from the risk/reward perspective at the moment. We will keep you informed should anything change, or should we see a confirmation/invalidation of the above.
AUD/USD
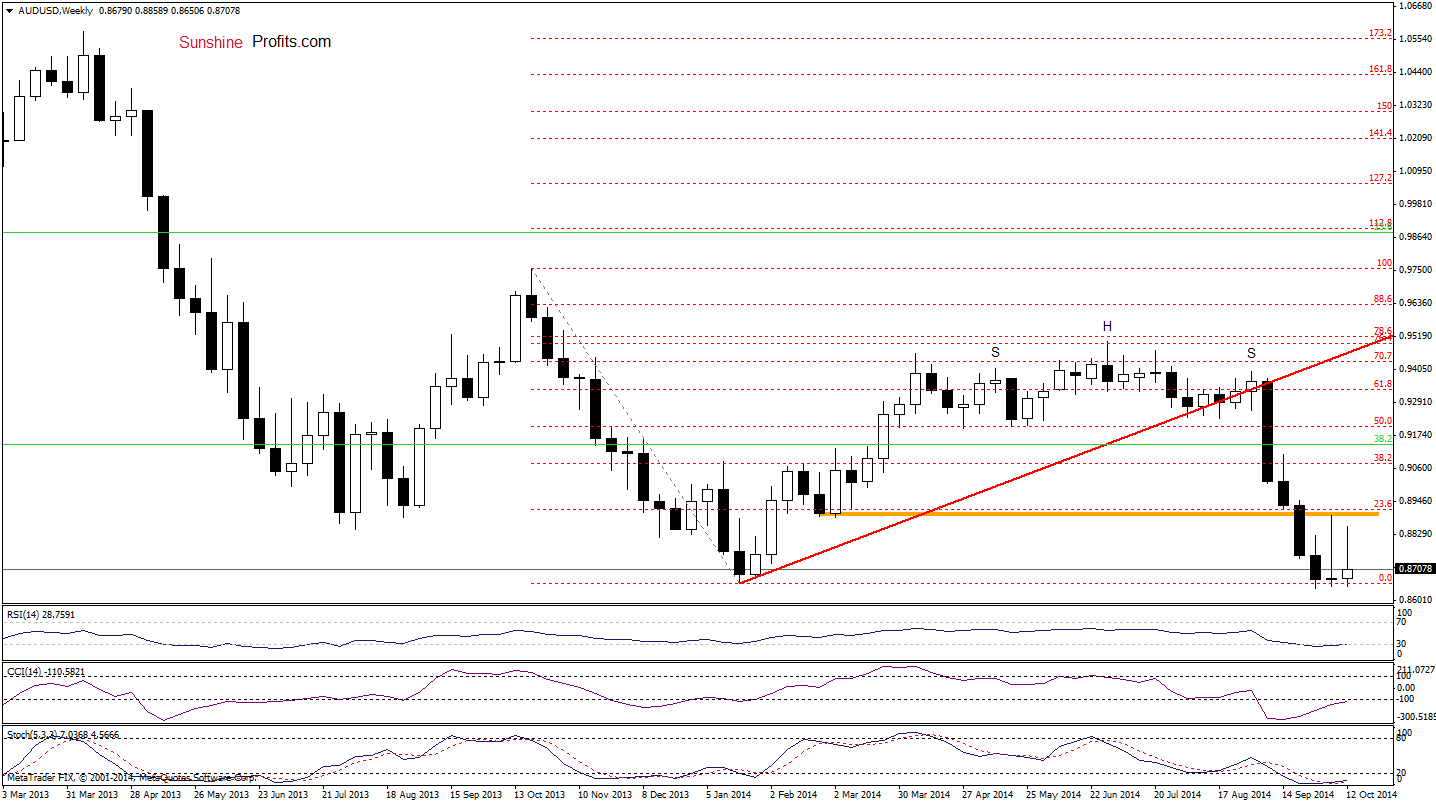
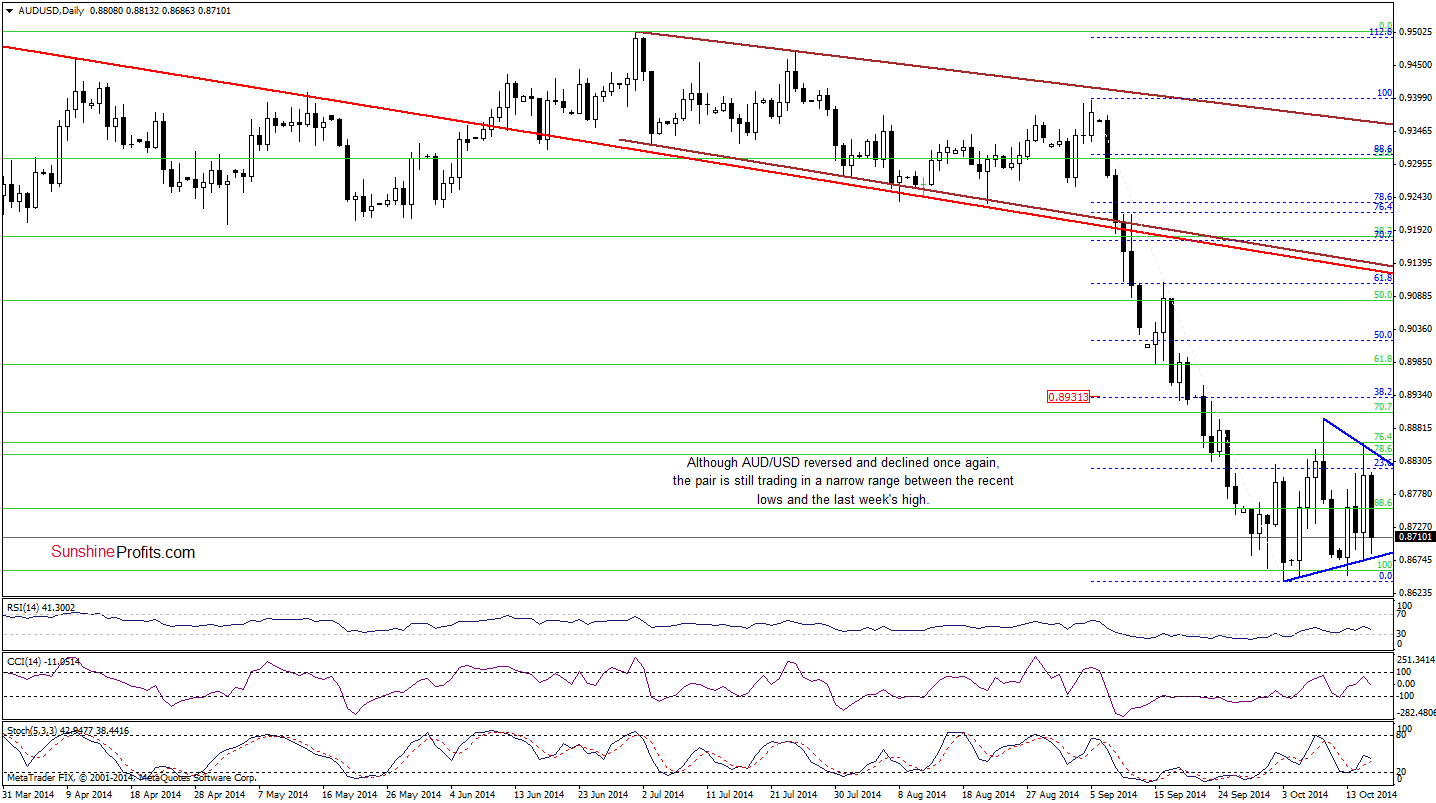
As you see on the above charts, although the situation in the very short term has deteriorated slightly as AUD/USD reversed and declined once again, the medium-term picture remains almost unchanged as the pair is still trading in a narrow range between the resistance level based on the March low (marked with orange on the weekly chart) and the recent lows. Therefore, it seems to us that a bigger upside move will be more likely if the exchange rate breaks above the Oct 9 high of 0.8896. Until this time, short-lived moves in both directions should not surprise us –especially when we factor in the fact that we can write in the recent price moves into the framework of the triangle (marked with blue on the daily chart). Taking the above into account, we think that a breakout above the upper line of the formation, will be sufficiently strong signal to trigger further improvement.
Very short-term outlook: mixed with bullish bias
Short-term outlook: mixed
MT outlook: mixed
LT outlook: bearish
Trading position (short-term; our opinion): Long positions with a stop-loss order at 0.8587 are justified from the risk/reward perspective at the moment. We will keep you informed should anything change, or should we see a confirmation/invalidation of the above.
Thank you.
Nadia Simmons
Forex & Oil Trading Strategist
Przemyslaw Radomski, CFA
Founder, Editor-in-chief
Gold & Silver Trading Alerts
Forex Trading Alerts
Oil Investment Updates
Oil Trading Alerts
