
Forex Trading Alert originally sent to subscribers on October 9, 2014, 10:53 AM.
Earlier today, the U.S. Department of Labor reported that the initial jobless claims in the week ending October 4 decreased by 1,000, beating analysts’ expectations for a 6,000 increase. In response, the U.S. dollar moved higher and EUR/USD erased some gains. Did this move change the very short-term picture?
In our opinion the following forex trading positions are justified - summary:
- EUR/USD: long (stop-loss order: 1.2560; initial price target: 1.3072)
- GBP/USD: none
- USD/JPY: short (stop-loss order: 110.73; initial price target: 105.20)
- USD/CAD: short (stop-loss order: 1.1360; initial price target: 1.1021)
- USD/CHF: short (stop-loss order: 0.9711; initial price target: 0.9332)
- AUD/USD: long (stop-loss order: 0.8587; initial price target: 0.8943)
EUR/USD
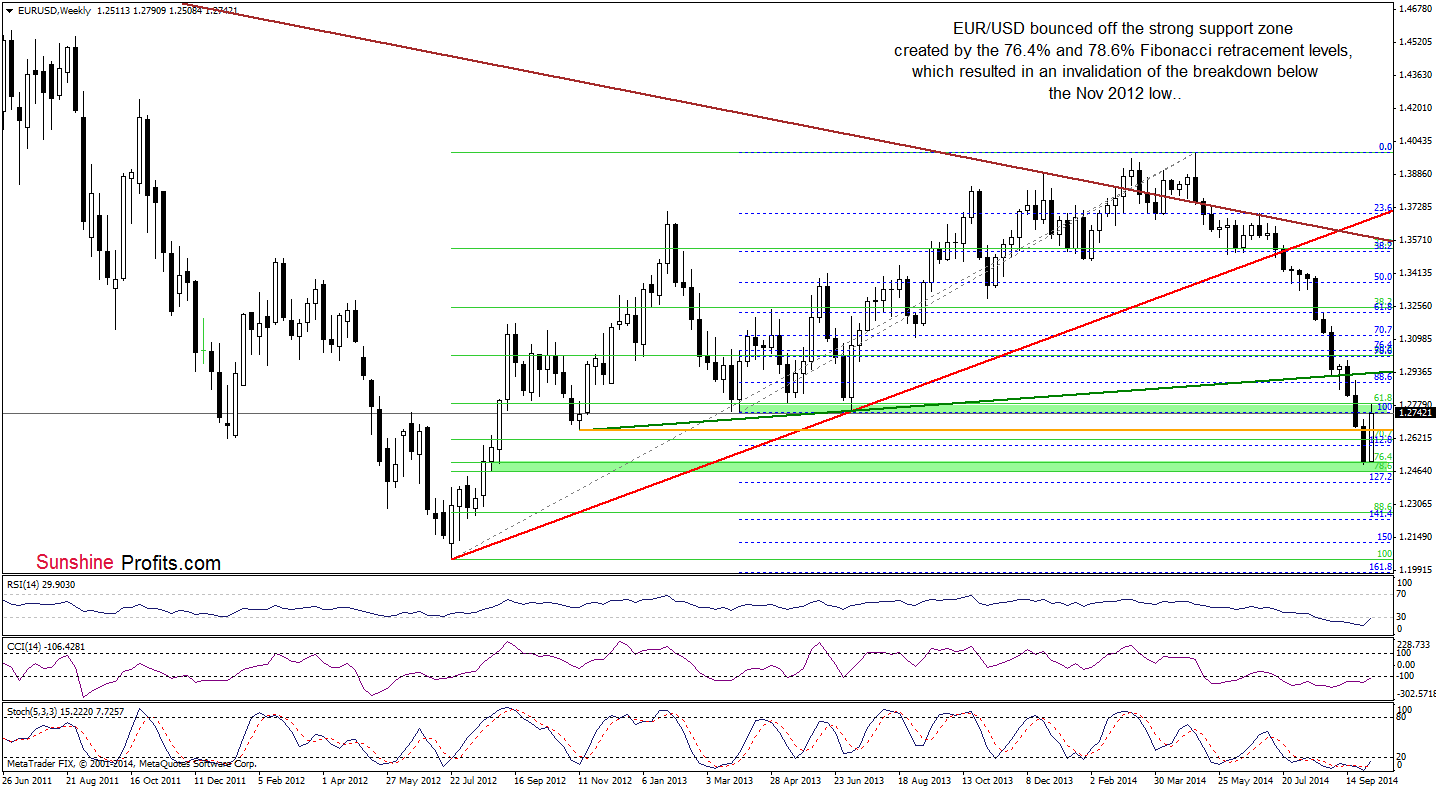
The first thing that catches the eye on the above chart is an invalidation of the breakdown below the Nov 2012 low. Although this is a bullish signal that suggests further improvement, we should keep in mind that the exchange rate reached the resistance zone (created by the Apr, Jul 2013 lows and the previously-broken 61.8% Fibonacci retracement ), which could pause further improvement. Will we see such price action in the coming week? Let’s examine the daily chart and look for more clues about future moves.
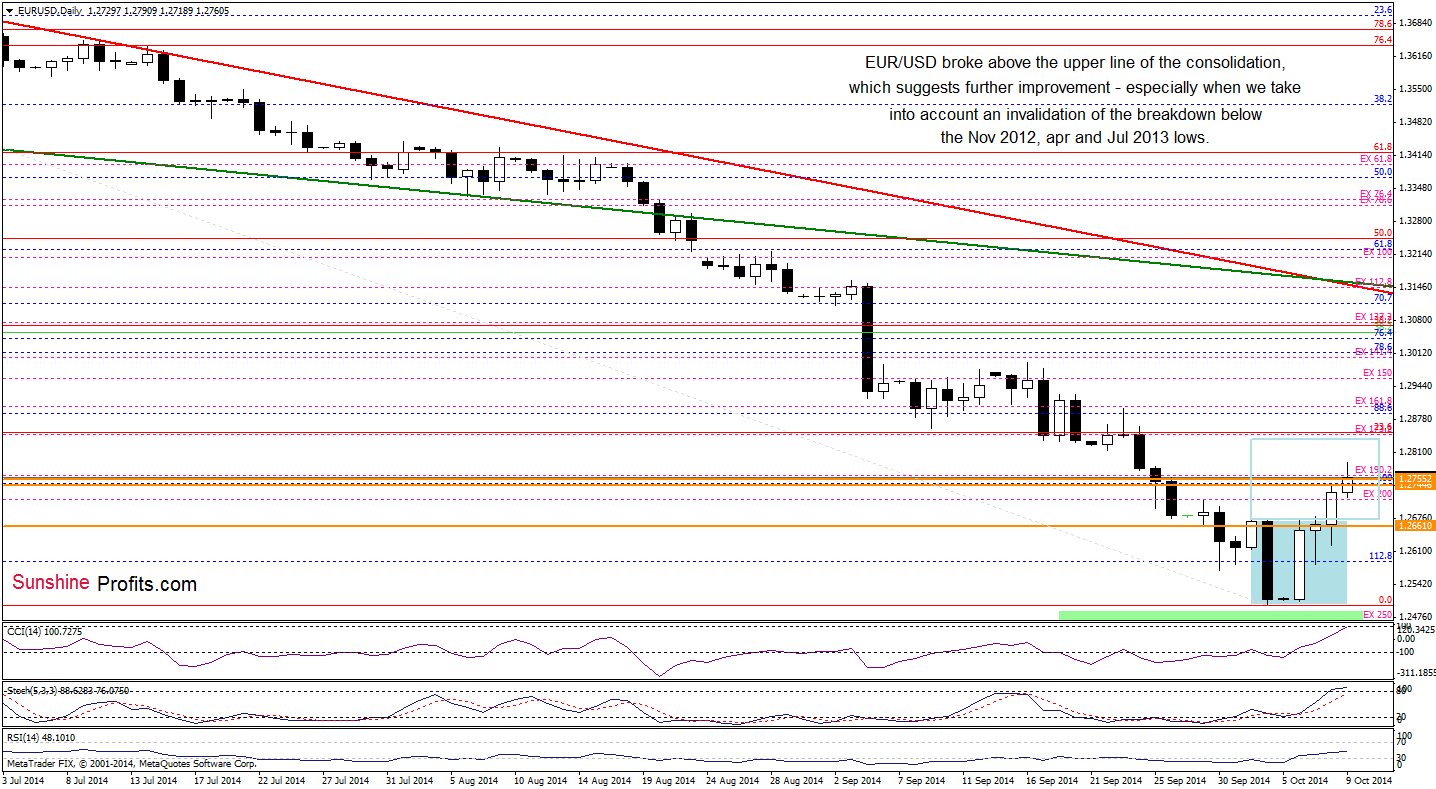
Looking at the above chart, we see that EUR/USD broke above the upper line of the consolidation, which suggests further improvement – to at least 1.2840, where the size of the upward move will correspond to the height of the formation. Nevertheless, as long as there is no invalidation of the breakdown below the Apr and Jul lows, currency bulls might have some problems with realization of the above-mentioned pro-growth scenario. Although the exchange rate climbed above these levels earlier today, we think that further rally will be more likely if we see a daily closure above 1.2755. Otherwise, a pullback from here to the previously-broken upper border of the consolidation should not surprise us.
Very short-term outlook: bullish
Short-term outlook:mixed with bullish bias
MT outlook: mixed
LT outlook: bearish
Trading position (short-term; in our opinion): Long positions with a stop-loss order at 1.2560 are justified from the risk/reward perspective at the moment. We will keep you informed should anything change, or should we see a confirmation/invalidation of the above.
USD/CAD
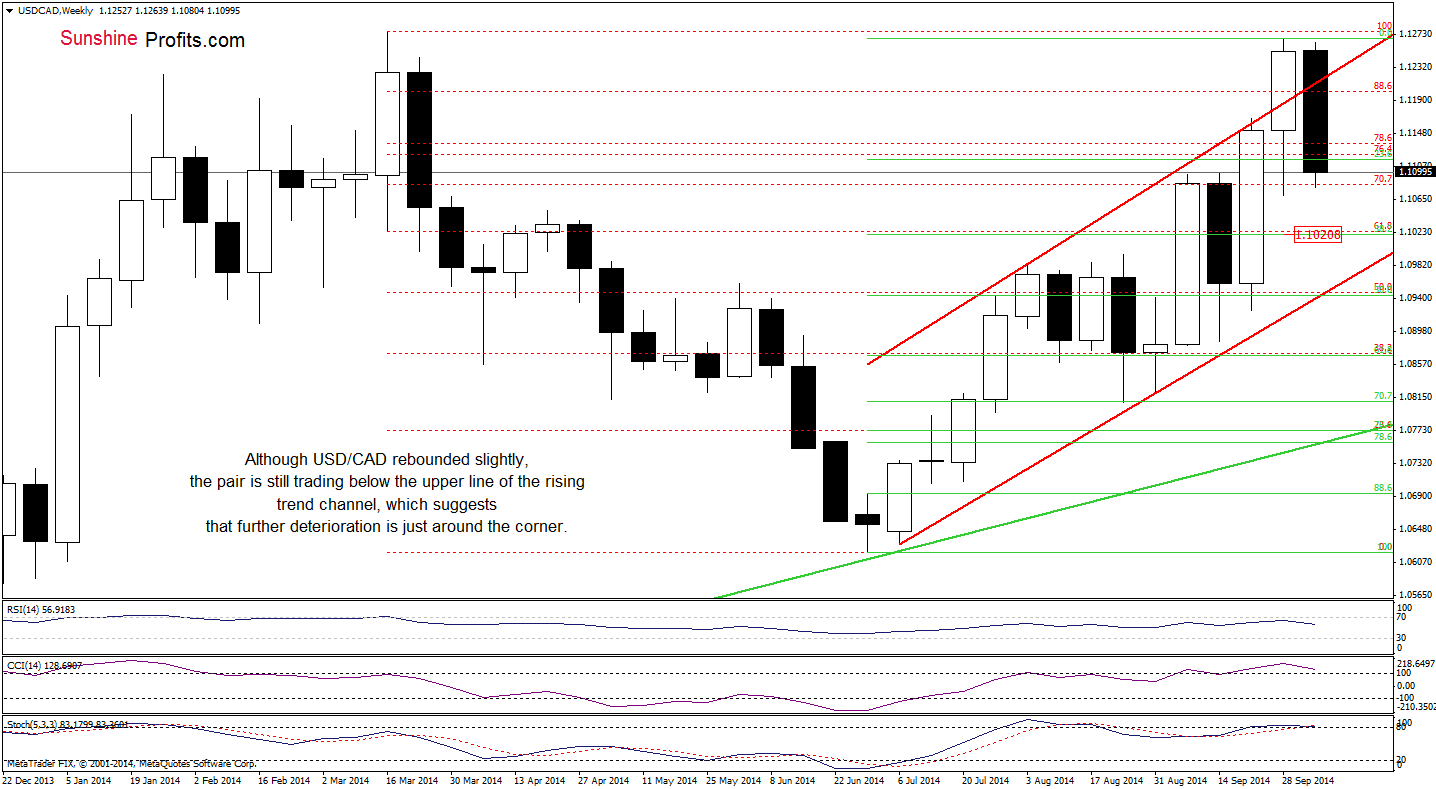
From this perspective, we see that although USD/CAD rebounded slightly, the exchange rate is still trading under the upper border of the rising trend channel, which together with the March high keeps gains in check. Can we infer something more from the daily chart? Let’s check.
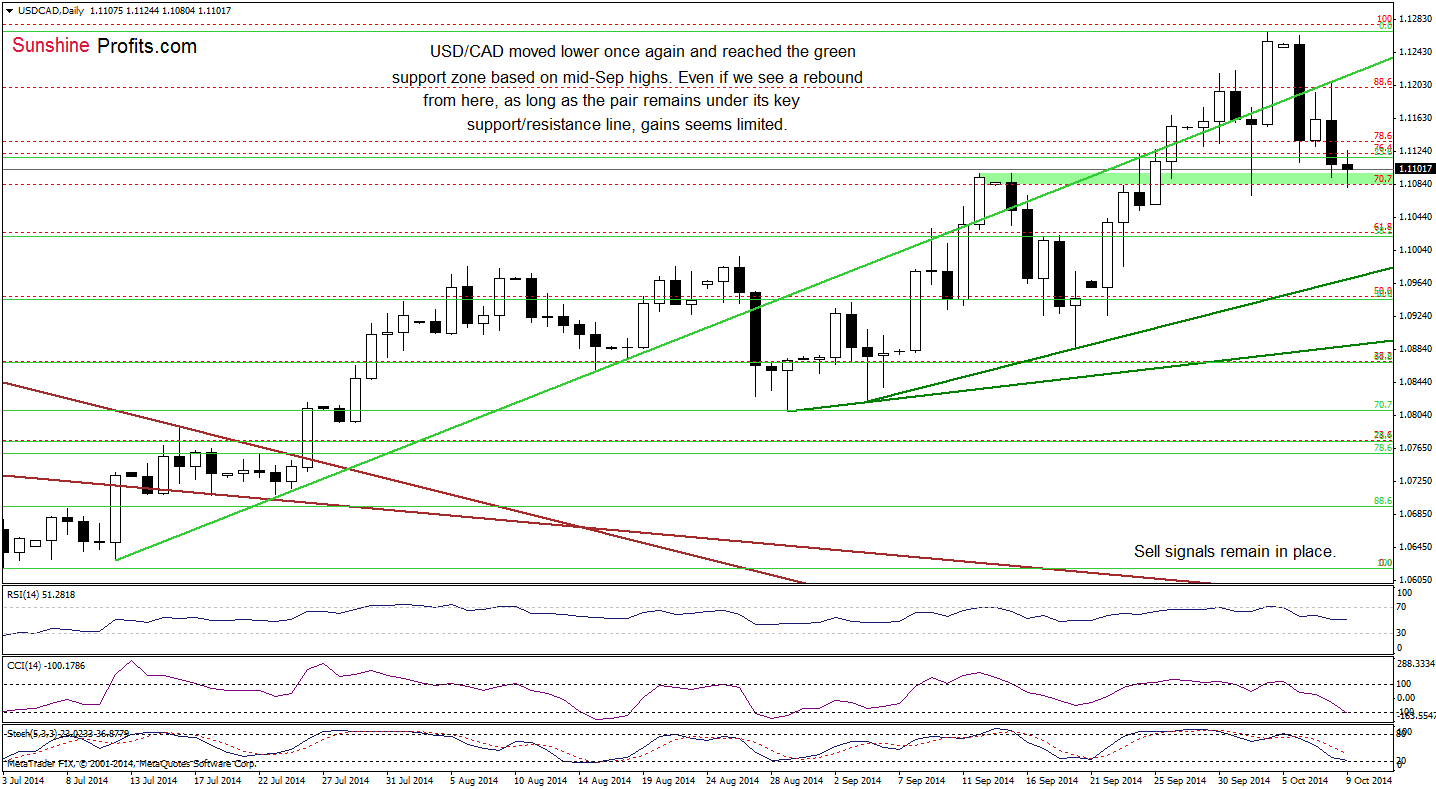
As you see on the above chart, the exchange rate extended losses and dropped to our initial downside target. Therefore, what we wrote in our last commentary on this currency pair is up-to-date:
(…) we think that the next sizable move will be to the downside. In our opinion, the correcion will accelerate, if the pair drops under the support area created by the mid-Sep highs and the Oct 2 low. If this is the case, we’ll see further corrction and the downside target would be around 1.1021, where the 38.2% Fibonacci retracement (based on the Jul-Oct rally) is.
Very short-term outlook: bearish
Short-term outlook: bearish
MT outlook: mixed with bearish bias
LT outlook: bearish
Trading position (short-term; our opinion): Short positions with a stop-loss order at 1.1360 are justified from the risk/reward perspective at the moment. We will keep you informed should anything change, or should we see a confirmation/invalidation of the above.
AUD/USD
Quoting our last commentary on this currency pair:
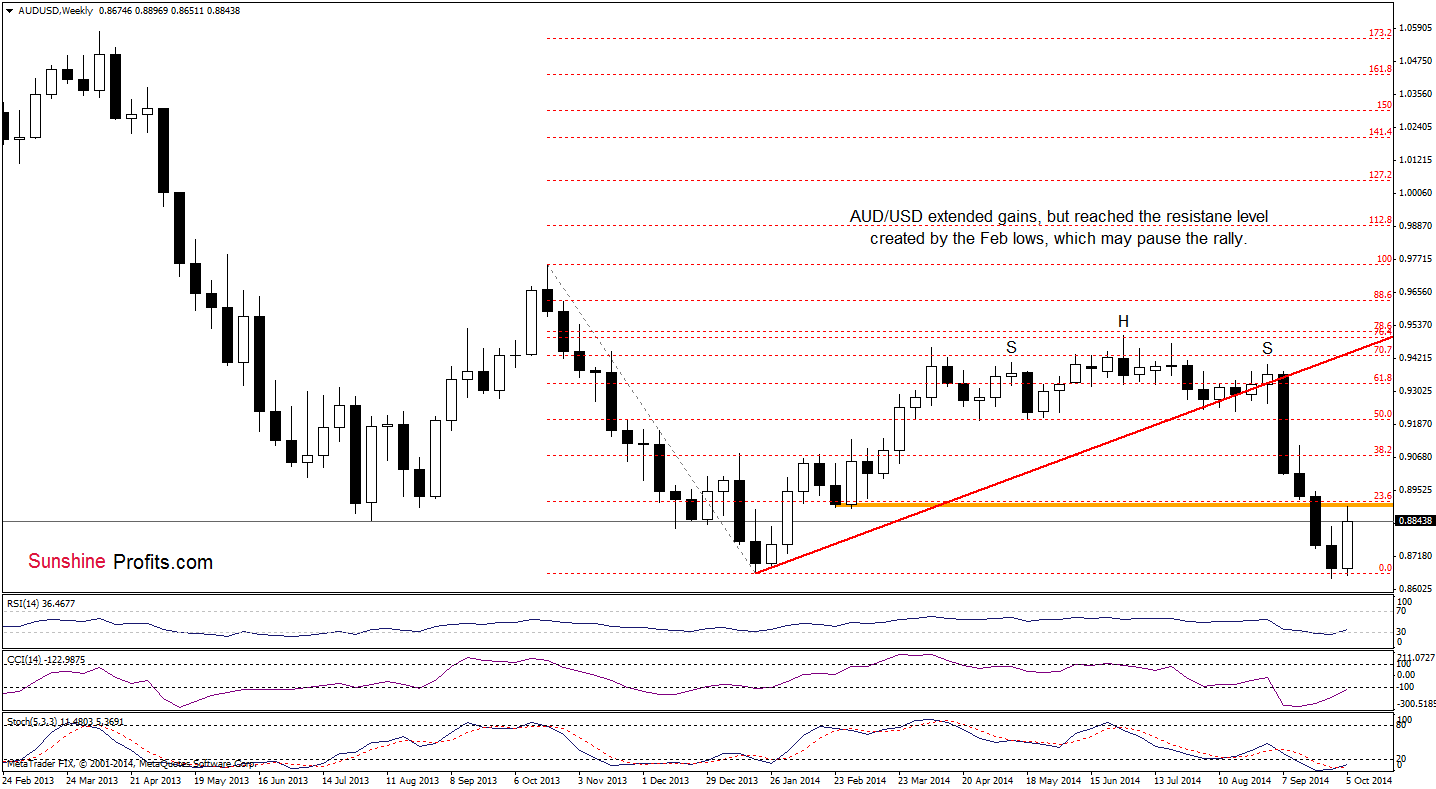
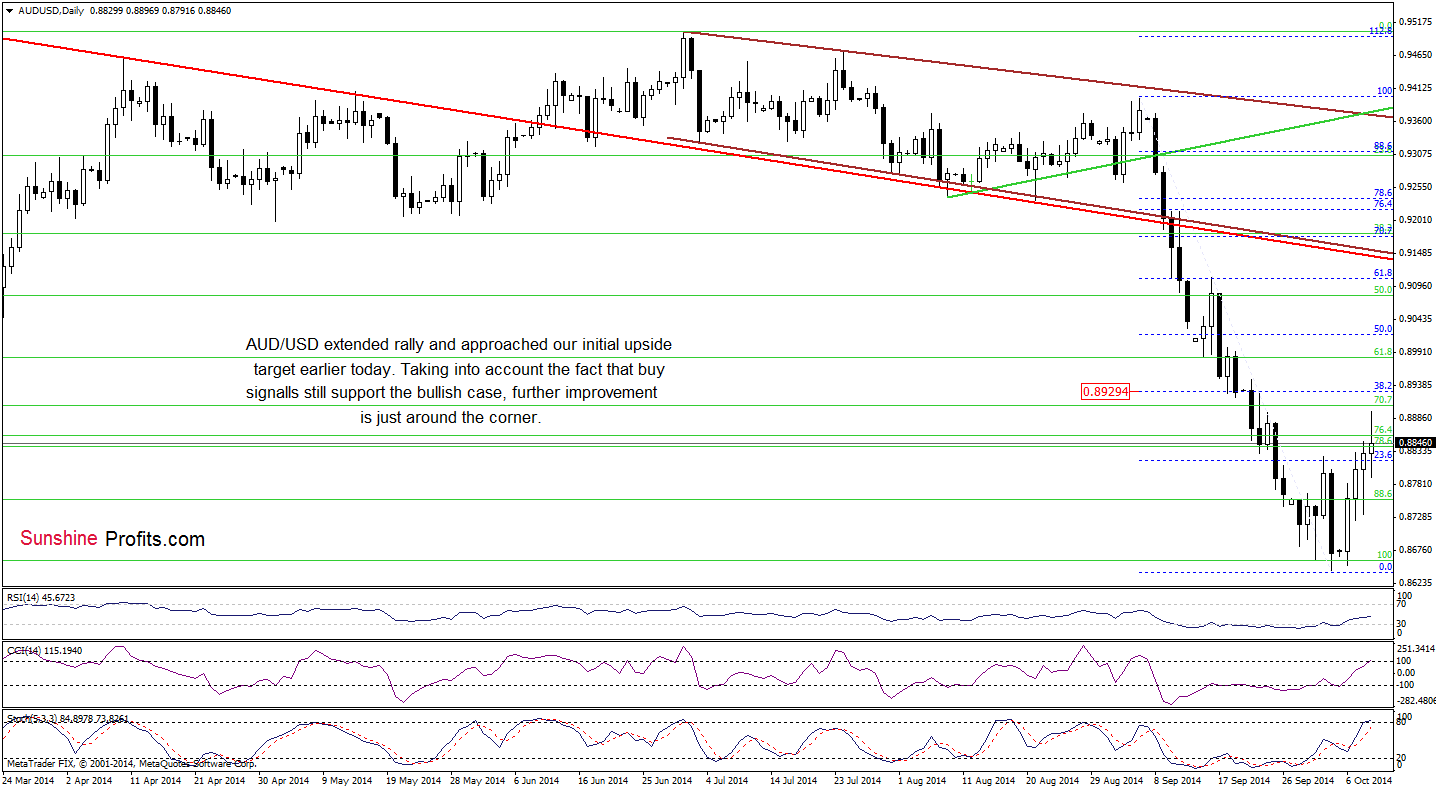
(…) we think that the next move will be to the upside and the initial target for currency bulls would be around 0.8929, where the 38.2% Fibonacci retracement based on the recent declines is. Please note that although the size of the upswing is not significant at the moment, we believe that a rally will accelerate if the weekly indicators also generate buy signals.
Looking at the above charts, we see that the situation developed in line with the above-mentioned scenario and AUD/USD extended rally, approaching our upside target. Taking into account the fact that buy signals still support the bullish case, we think that further improvement is just around the corner – even if the pair pauses as the resistance level based on the Feb lows still holds.
Very short-term outlook: mixed with bullish bias
Short-term outlook: mixed
MT outlook: mixed
LT outlook: bearish
Trading position (short-term; our opinion): Long positions with a stop-loss order at 0.8587 are justified from the risk/reward perspective at the moment. We will keep you informed should anything change, or should we see a confirmation/invalidation of the above.
Thank you.
Nadia Simmons
Forex & Oil Trading Strategist
Przemyslaw Radomski, CFA
Founder, Editor-in-chief
Gold & Silver Trading Alerts
Forex Trading Alerts
Oil Investment Updates
Oil Trading Alerts
