
Forex Trading Alert originally sent to subscribers on September 30, 2014, 10:36 AM.
Earlier today, data showed that consumer price inflation in the euro zone fell to 0.3% in September from 0.4% in the previous month. Thanks to these disappointing numbers, the euro dropped to a two-year low against the U.S. dollar after and the EUR/USD slipped to the next support level. Will we finally see a rebound from here?
In our opinion the following forex trading positions are justified - summary:
- EUR/USD: long (stop-loss order: 1.2527; initial price target: 1.3188)
- GBP/USD: none
- USD/JPY: short (stop-loss order: 110.73; initial price target: 105.20)
- USD/CAD: none
- USD/CHF: none
- AUD/USD: none
EUR/USD
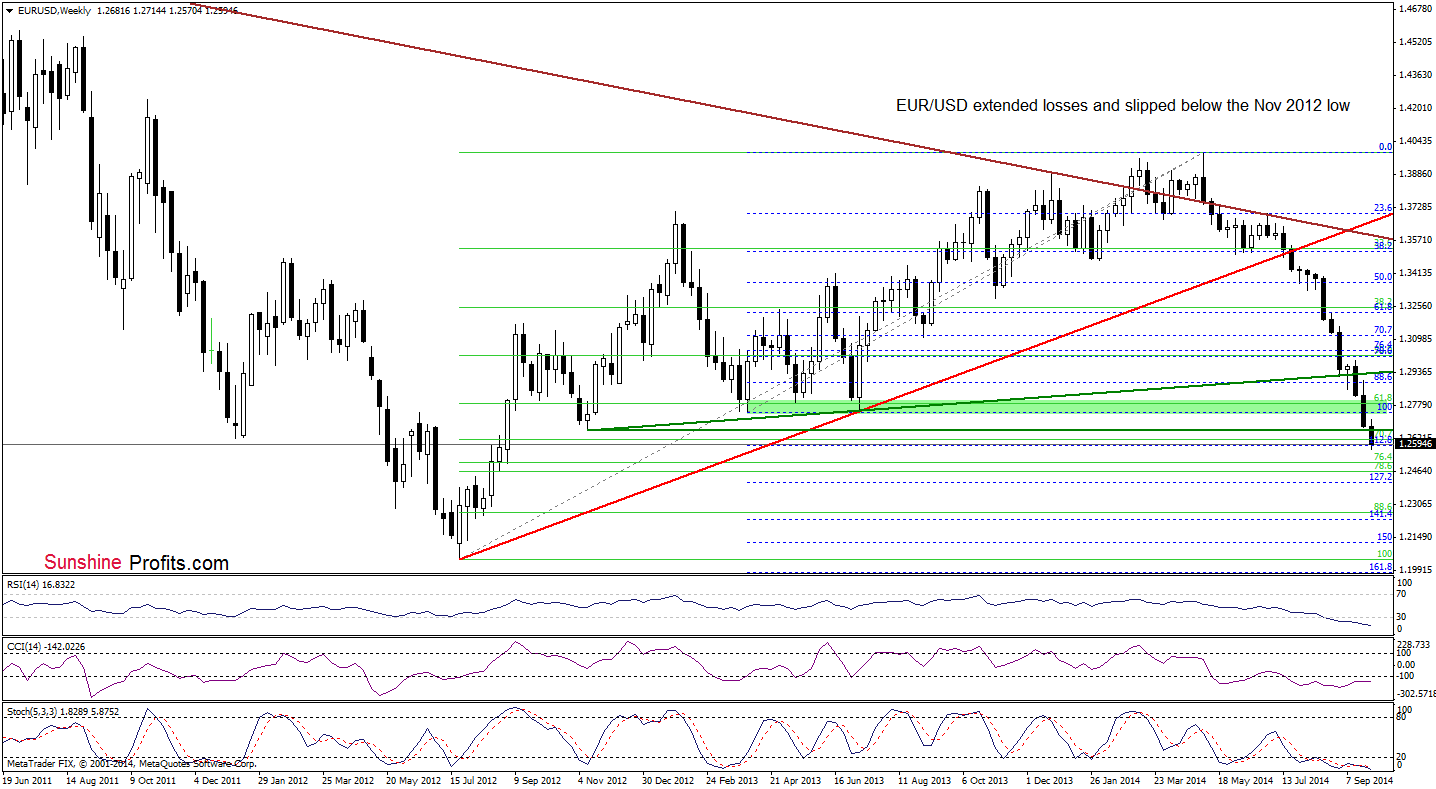
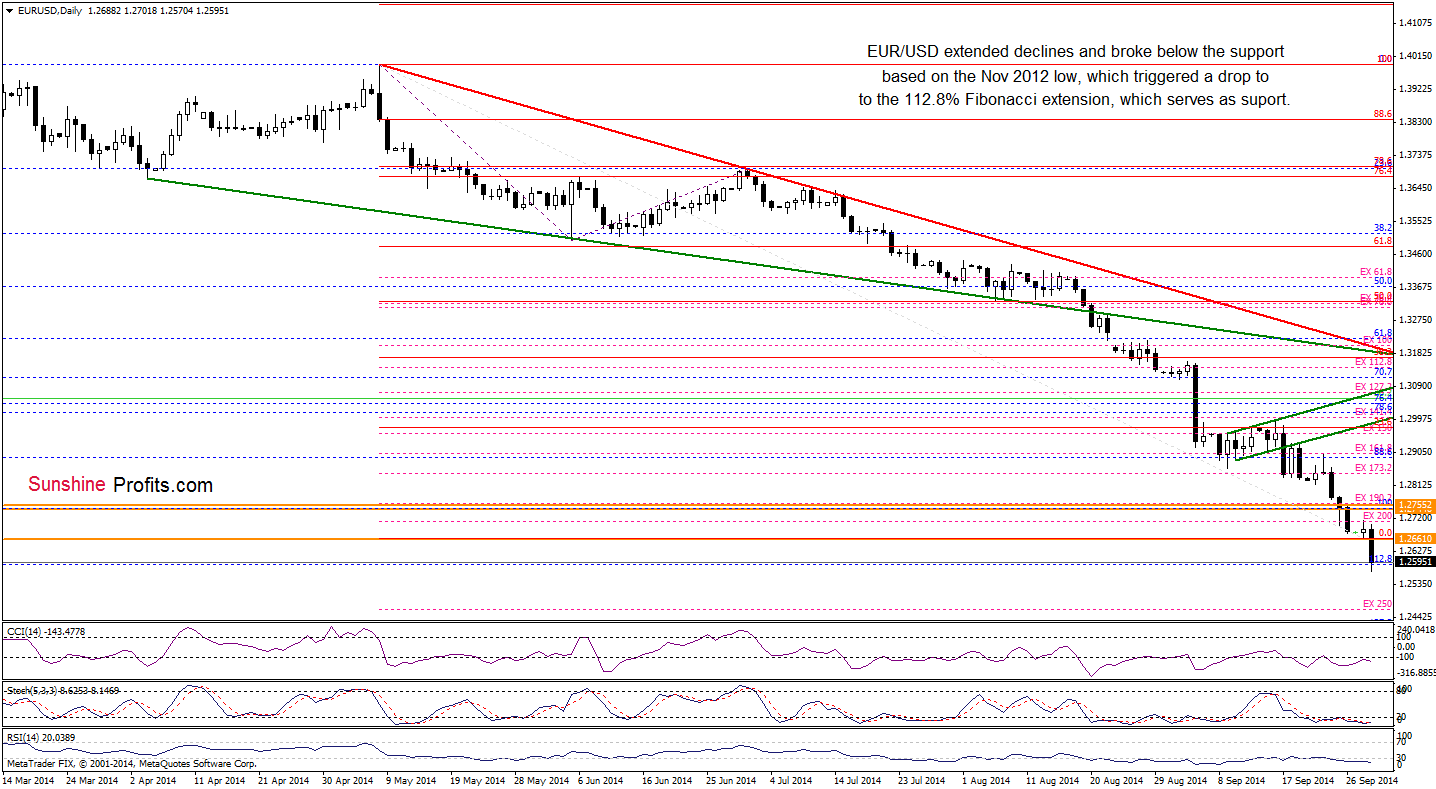
The overall situation has deteriorated as EUR/USD broke below the Nov 2012 low, extending earlier declines. With this downward move, the pair reached the next support level created by the 112.8% Fibonacci extension. If this area encourages currency bulls to act, we’ll see a rebound from here and the initial upside target will be the Apr and Jul 2013 lows – especially if the indicators generate buy signals. Please note that they are not only oversold, but there are clearly visible positive divergences between them and the exchange rate, which suggests that a bigger upward move is just around the corner.
Very short-term outlook: bullish
Short-term outlook:mixed with bullish bias
MT outlook: mixed
LT outlook: bearish
Trading position (short-term; our opinion): Long positions with a stop-loss order at 1.2527 (we decided to move it little lower) are justified from the risk/reward perspective at the moment. We will keep you informed should anything change, or should we see a confirmation/invalidation of the above.
GBP/USD
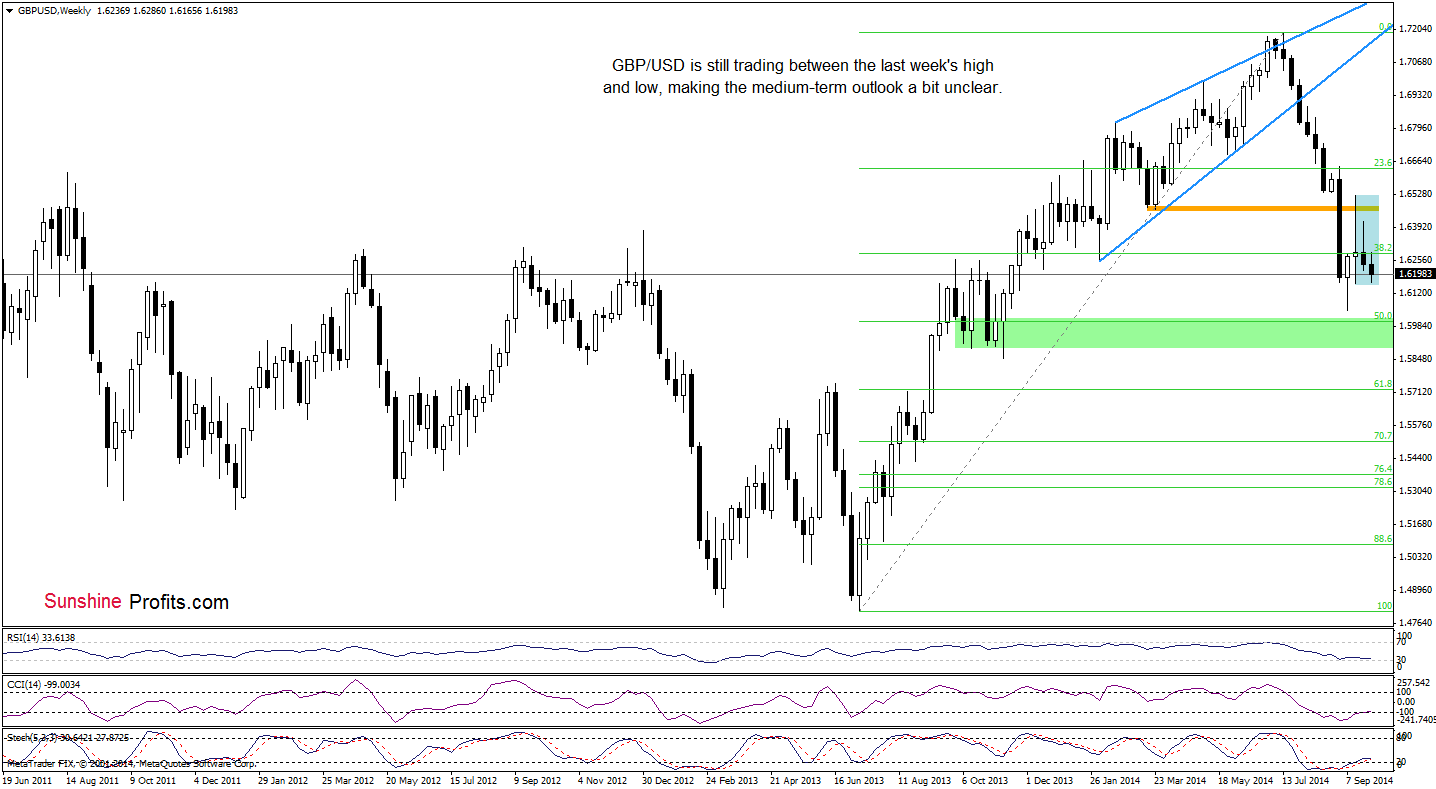
The medium-term picture hasn’t changed much as GBP/USD is trading in a consolidation (marked with blue). What’s next? Let’s examine the daily chart and look for some clues about future moves.
In our Forex Trading Alert posted on Sep 23, we wrote the following:
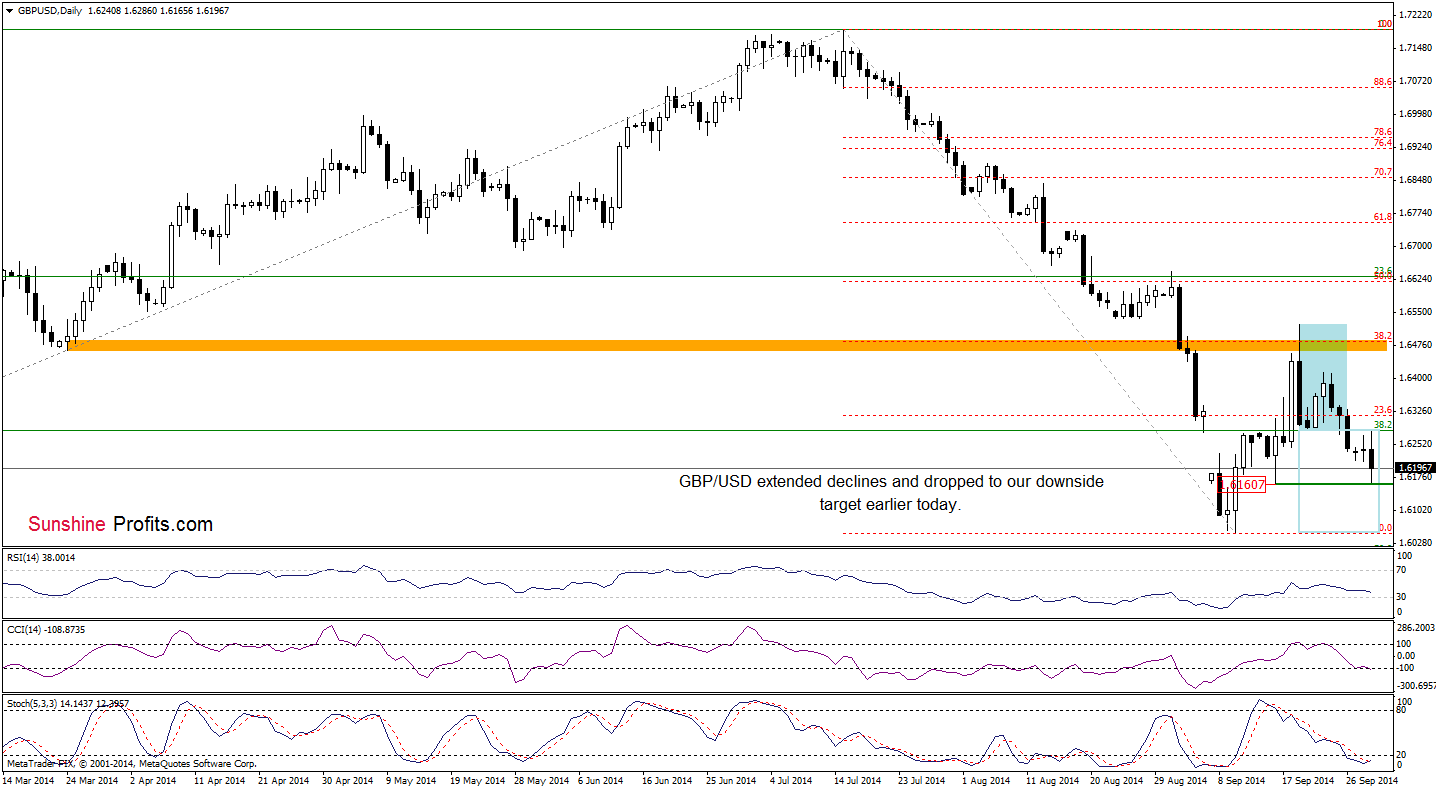
(…) What’s next? The current position of the CCI and Stochastic Oscillator suggests that GBP/USD will likely test the strength of the lower border of the formation. If it’s broken, we’ll see a drop to 1.6161 (the Sep 16 low) or even a test of the Sep low of 1.6051.
Looking at the above chart, we see that currency bears realized partly the above-mentioned scenario (as we expected) and the pair reached our initial downside target. Taking this fact into account and combining with the current position of the indicators, we think that the next move will be to the upside. Nevertheless, as long as there are no buy signals, another attempt to move lower can’t be ruled out.
Very short-term outlook: mixed
Short-term outlook: mixed
MT outlook: mixed
LT outlook: mixed
Trading position (short-term): In our opinion, no positions are justified from the risk/reward perspective. We will keep you informed should anything change, or should we see a confirmation/invalidation of the above.
AUD/USD

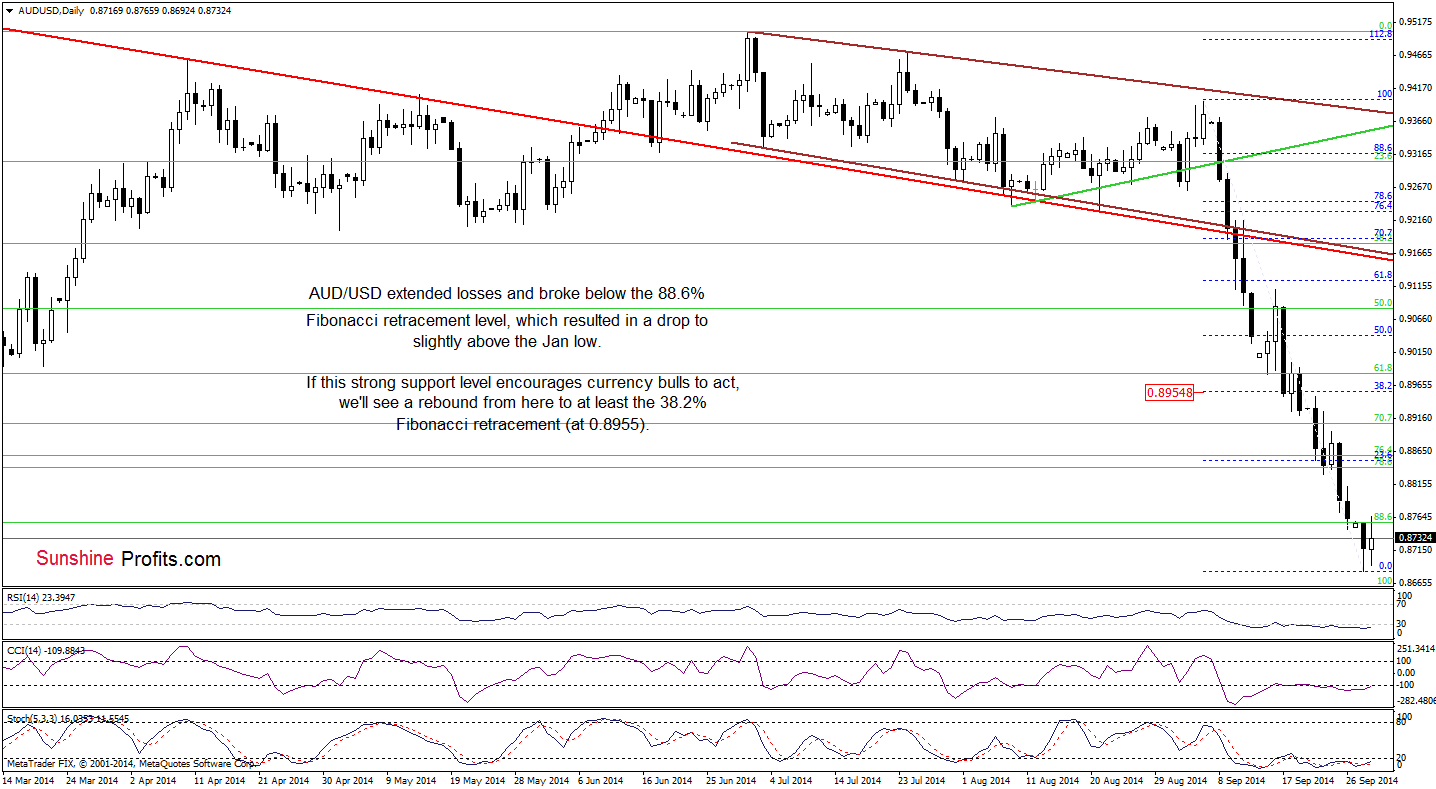
The situation in the medium term has deteriorated as AUD/USD extended declines and approached the 2014 low. If this solid support level holds, we may see a trend reversal in the coming week. Will the daily chart confirm this positive scenario? Let’s check.
Quoting our commentary posted on Sep 23:
(…) if currency bears show their claws and manage to push the pair lower, it would be a strong negative signal, which could trigger a drop even to around 0.8756, where the next Fibonacci retracement is. At this point, it’s worth noting that slightly below this level (at 0.8729) is the Feb 4 low, which together create a next support area.
As you see the situation developed in line with the above-mentioned scenario as AUD/USD reached our downside target. However, currency bulls didn’t manage to protect the support area and the exchange rate extended declines, approaching the Jan low. What’s next? When we take a closer look at the chart, we clearly see positive divergences between all indicators and the exchange rate, which suggests that a pause or corrective upswing is just around the corner (especially if the indicators generate buy signals). If this is the case, the initial upside target will be around 0.8955, where the 38.2% Fibonacci retracement based on the recent declines is.
Very short-term outlook: mixed with bullish bias
Short-term outlook: mixed
MT outlook: mixed
LT outlook: bearish
Trading position (short-term): In our opinion no positions are justified from the risk/reward perspective. We will keep you informed should anything change, or should we see a confirmation/invalidation of the above.
Thank you.
Nadia Simmons
Forex & Oil Trading Strategist
Przemyslaw Radomski, CFA
Founder, Editor-in-chief
Gold & Silver Trading Alerts
Forex Trading Alerts
Oil Investment Updates
Oil Trading Alerts
