
Forex Trading Alert originally sent to subscribers on September 23, 2014, 11:50 AM.
Earlier today, USD Index, which tracks the performance of the U.S. dollar against a basket of major currencies, pulled back from over a four-year high. As a result, EUR/USD climbed above yesterday’s high. Is this a short-lived improvement or the first sign of a trend reversal?
In our opinion the following forex trading positions are justified - summary:
EUR/USD
The situation in the medium term remains unchanged as EUR/USD still remains below the 88.6% Fibonacci retracement and the long-term green support. Today, we’ll focus on the very short-term changes.
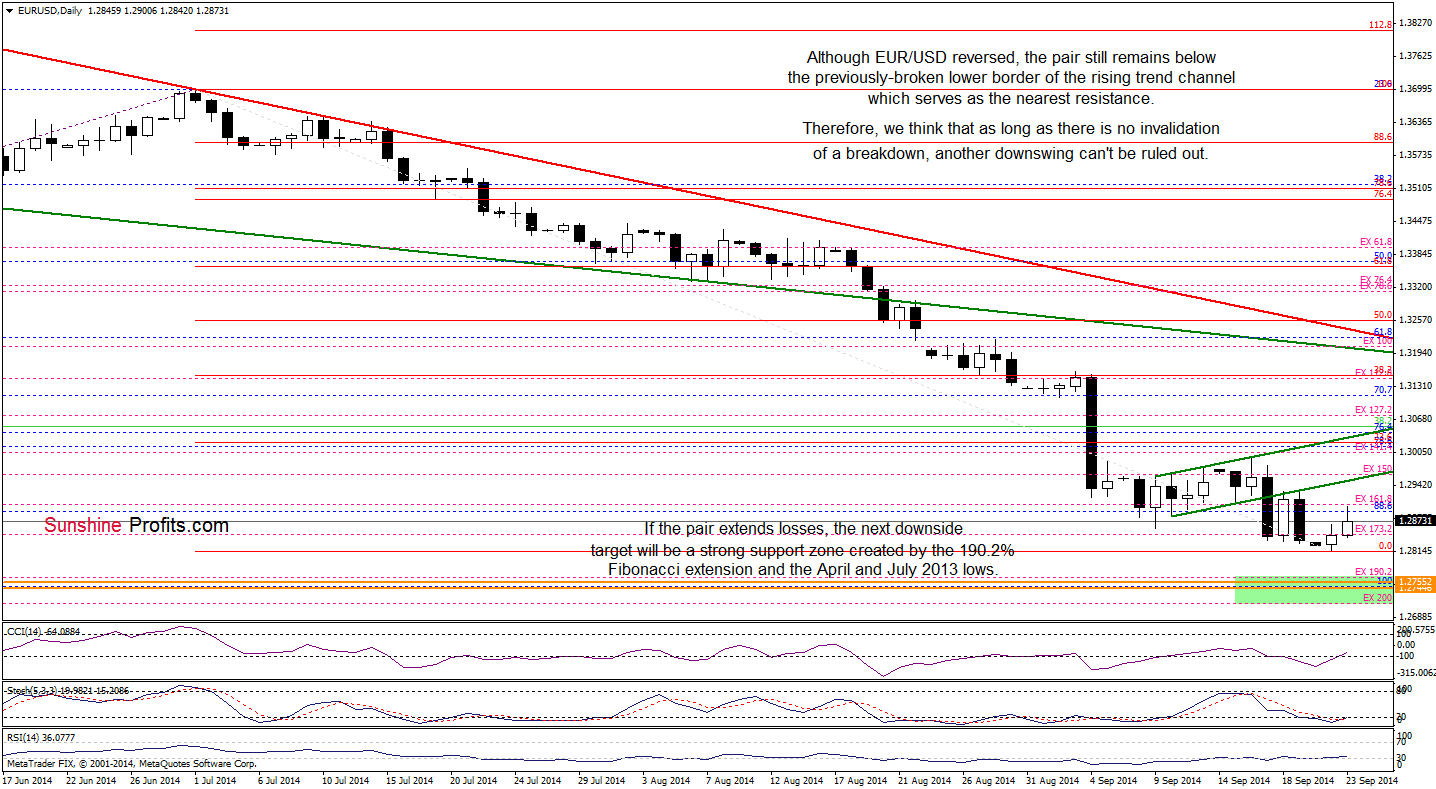
From this perspective, we see that although EUR/USD moved higher, the pair is still trading well below the previously-broken lower border of the rising trend channel. Therefore, we think that as long as there is no invalidation of a breakdown below this key line, another attempt to move lower can’t be ruled out. If this is the case, the initial downside target would be the recent low of 1.2816. If it’s broken, we could see a drop to the green support zone (around 1.2745-1.2755) created by the Apr and Jul 2013 lows and the 61.8% Fibonacci retracement.
Very short-term outlook: mixed
Short-term outlook: mixed
MT outlook: mixed
LT outlook: bearish
Trading position (short-term): In our opinion, no positions are justified from the risk/reward perspective. We will keep you informed should anything change, or should we see a confirmation/invalidation of the above.
GBP/USD
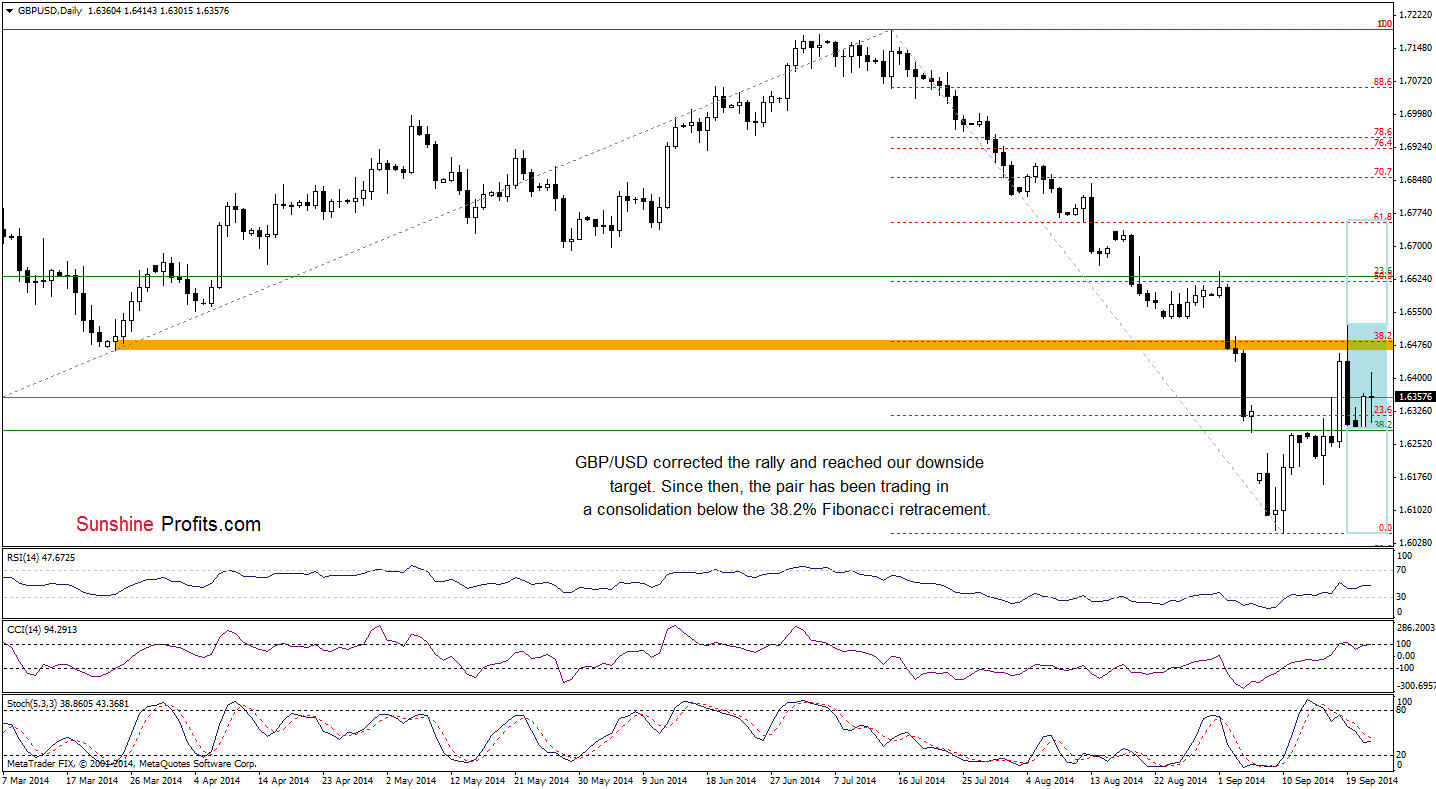
The medium-term picture hasn’t changed much as GBP/USD is trading between the last week’s high and low. Today, we’ll examine the daily chart.
Quoting our last commentary on this currency pair:
(...) the pair reversed and declined, invalidating earlier breakout above these levels. This is a bearish signal, which suggests further deterioration and a drop to around 1.6280, where the Sep 5 low is. Please note that the Stochastic Oscillator generated a sell signal, supporting the bearish case.
Looking at the above chart, we see that currency bears realized the above-mentioned scenario as we expected and the pair reached our downside target. Since then, the exchange rate has been trading in a consolidation (marked with blue) between the last week’s low and the key resistance level created by the 38.2% Fibonacci retracement. What’s next? The current position of the CCI and Stochastic Oscillator suggests that GBP/USD will likely test the strength of the lower border of the formation. If it’s broken, we’ll see a drop to 1.6161 (the Sep 16 low) or even a test of the Sep low of 1.6051. Nevertheless, if currency bulls manage to successfully break above the 38.2% Fibonacci retracement, the next upside target would be around 1.6619, where the Sep high and the 50% Fibonacci retracement are.
Very short-term outlook: mixed with bearish bias
Short-term outlook: mixed
MT outlook: mixed
LT outlook: mixed
Trading position (short-term): In our opinion, no positions are justified from the risk/reward perspective. We will keep you informed should anything change, or should we see a confirmation/invalidation of the above.
AUD/USD
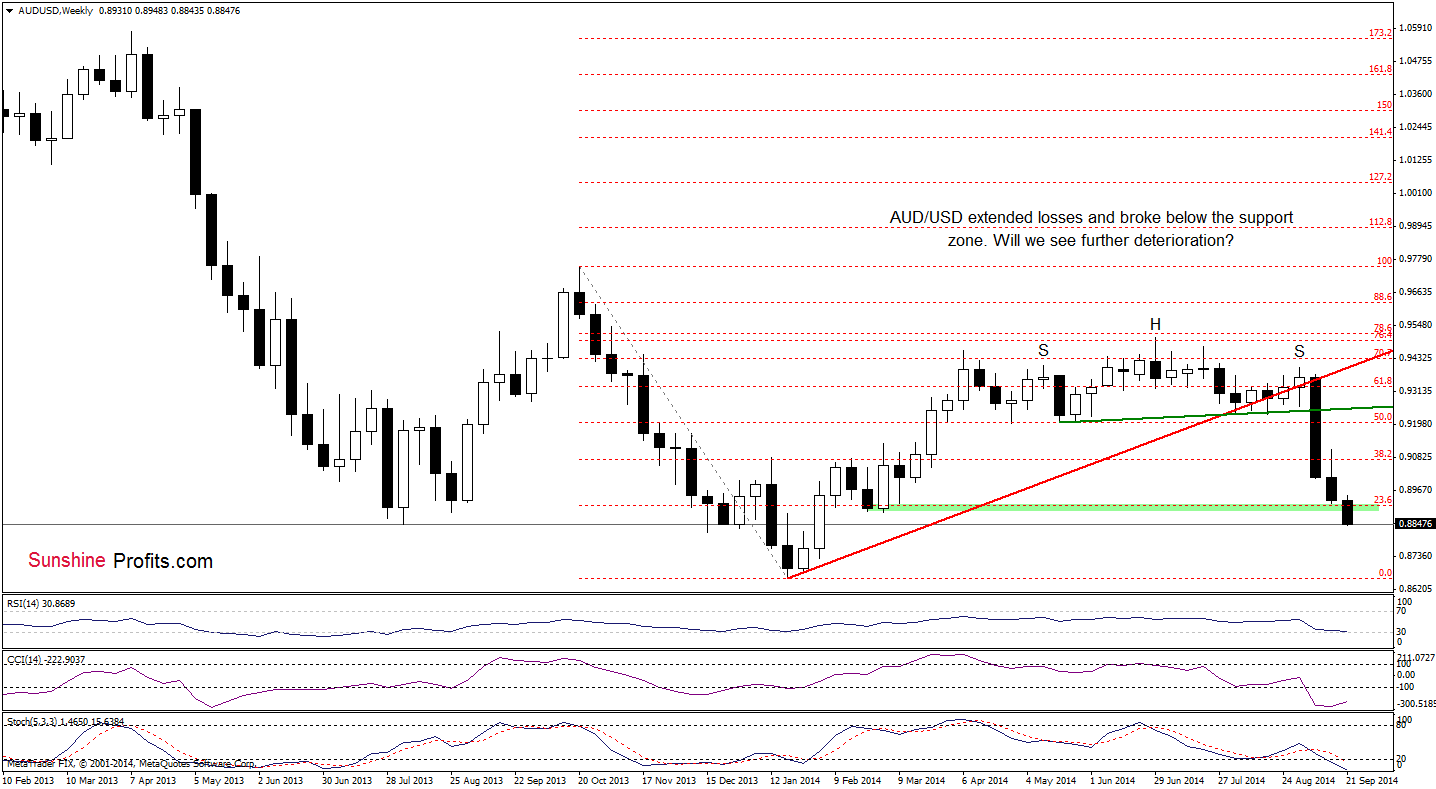
The situation in the medium term has deteriorated as AUD/USD broke below the Feb and March lows. Thanks to this bearish signal, the exchange rate hit a fresh seven-month low. How low could the pair drop? Let’s take a closer look at the daily chart and look for the answer to this question.
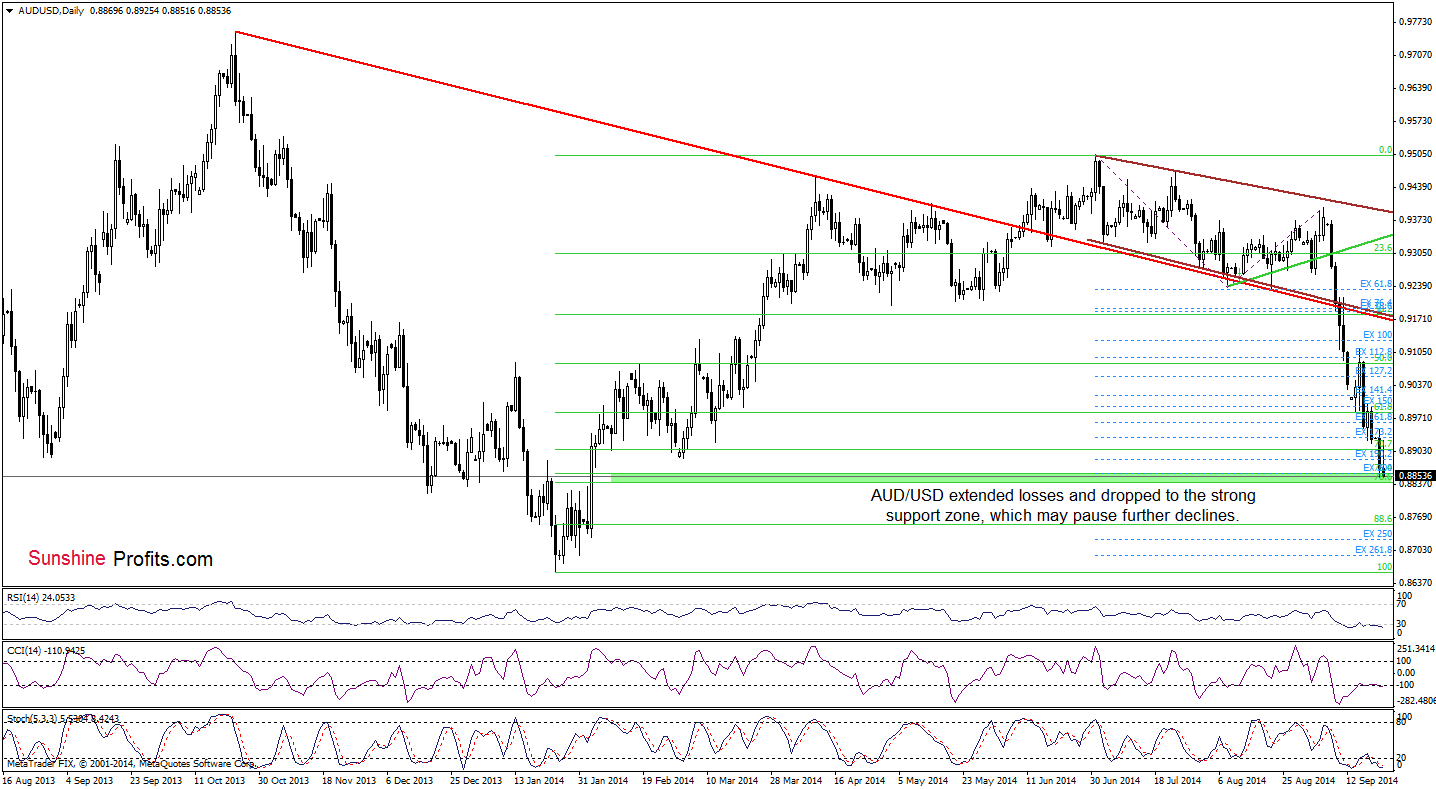
On the daily chart, we see that AUD/USD extended losses and dropped to the support zone created by the 76.4% and 78.6% Fibonacci retracement levels and the 200% Fibonacci price projection (based on the Jul and Sep highs and Aug low). Additionally, there are positive divergences between all three indicators and the exchange rate, which suggests that a pause (or a corrective upswing) is just around the corner. Nevertheless, if currency bears show their claws and manage to push the pair lower, it would be a strong negative signal, which could trigger a drop even to around 0.8756, where the next Fibonacci retracement is. At this point, it’s worth noting that slightly below this level (at 0.8729) is the Feb 4 low, which together create a next support area.
Very short-term outlook: mixed
Short-term outlook: mixed
MT outlook: mixed
LT outlook: bearish
Trading position (short-term): In our opinion no positions are justified from the risk/reward perspective. We will keep you informed should anything change, or should we see a confirmation/invalidation of the above.
Thank you.
Nadia Simmons
Forex & Oil Trading Strategist
Przemyslaw Radomski, CFA
Founder, Editor-in-chief
Gold & Silver Trading Alerts
Forex Trading Alerts
Oil Investment Updates
Oil Trading Alerts
