
Forex Trading Alert originally sent to subscribers on September 19, 2014, 8:48 AM.
Earlier today, U.S. dollar climbed to a fresh six-year high against the yen as Wednesday’s the Federal Reserve's decision to cut monthly bond-buying program by another $10 billion continued to support demand for the greenback. In this way USD/JPY approached the next resistance level. Will it be strong enough to stop currency bulls’ charge?
We are close to re-opening the positions aiming to profit from the big reversal in the currency market, but it seems that we could see a small continuation of the most recent moves and that opening positions at this time is still too risky.
In our opinion the following forex trading positions are justified - summary:
EUR/USD
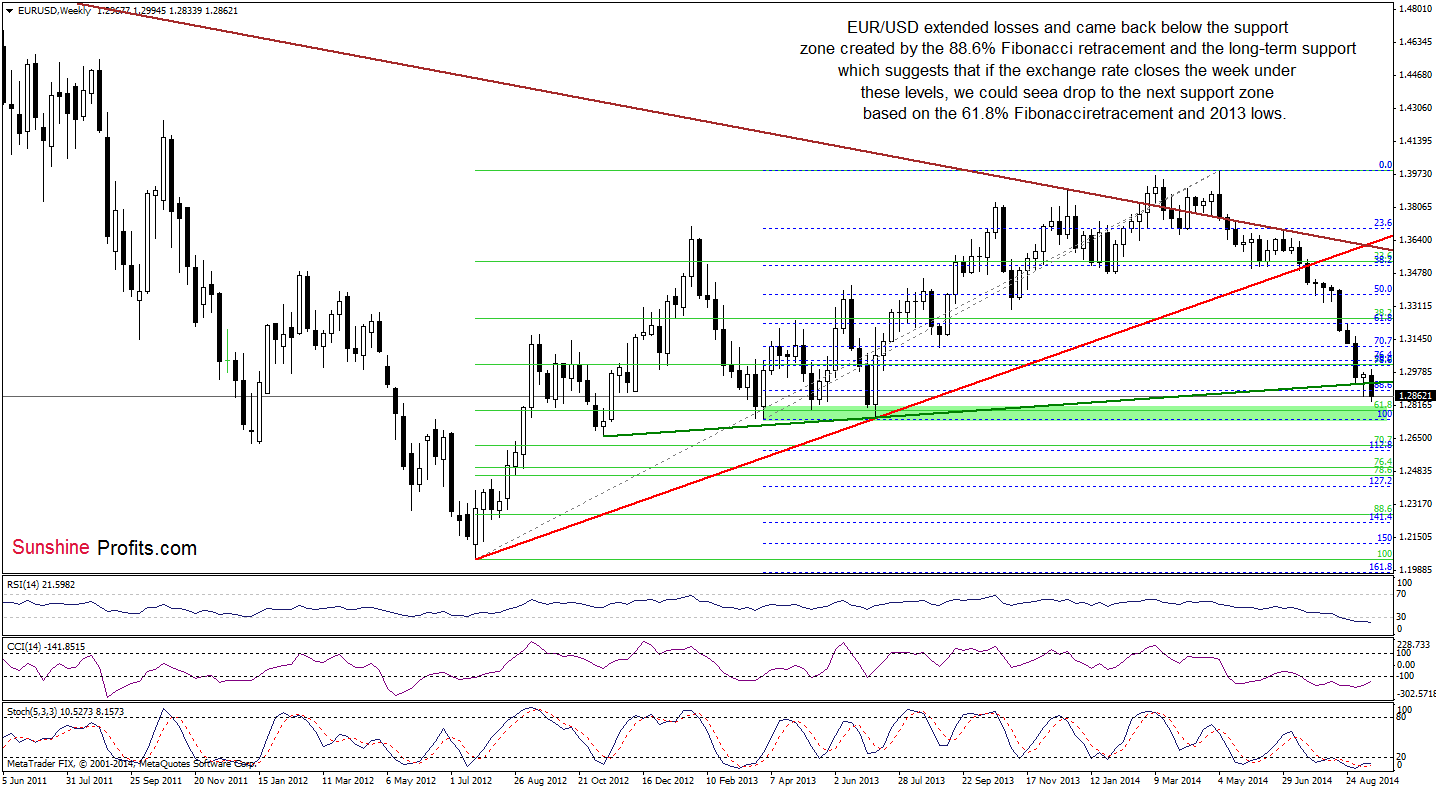
The situation in the medium term has deteriorated as EUR/USD moved lower once again and dropped below the support zone created by the 88.6% Fibonacci retracement and the long-term green support line based on the Nov 2012 and Jul 2013 lows. Taking this negative signal into account, it seems to us that EUR/USD would test the strength of the next support area based on the 61.8% Fibonacci retracement and the 2013 lows (around 1.2745-1.2787) in the coming week (especially if the pair closes this week under the long-term green support line).
Will the daily chart give us more clues about future moves? Let’s find out.
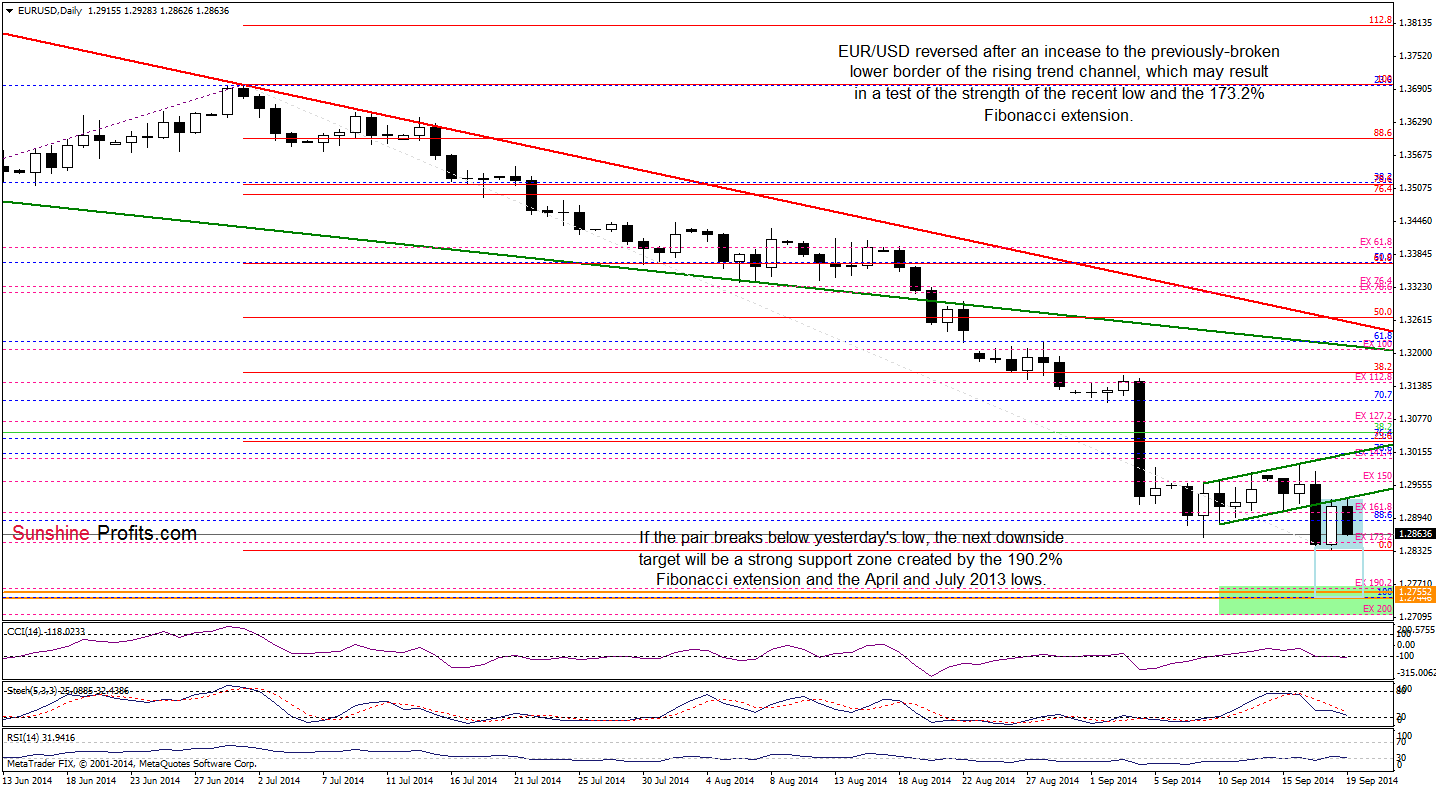
From this perspective, we see that although the exchange rate moved higher earlier today, currency bulls didn’t have enough strength to invalidate a breakdown below the lower border of the rising trend channel, which resulted in a pullback. Therefore, our last commentary on this currency pair is up-to-date:
(…) if currency bulls fail, we’ll see a test of the strength of the 173.2% Fibonacci extension, which serves as the nearest support at the moment.
Please note that EUR/USD is trading in a consolidation between the recent low and the key resistance line. Therefore, if the exchange rate breaks below the lower line of the formation, we could see a drop to the green support zone around 1.2745-1.2755 (in this area the size of the downswing would also correspond to the height of the consolidation).
Very short-term outlook: mixed
Short-term outlook: mixed
MT outlook: mixed
LT outlook: bearish
Trading position (short-term): In our opinion, no positions are justified from the risk/reward perspective. We will keep you informed should anything change, or should we see a confirmation/invalidation of the above.
GBP/USD
Quoting our previous Forex Trading Alert:
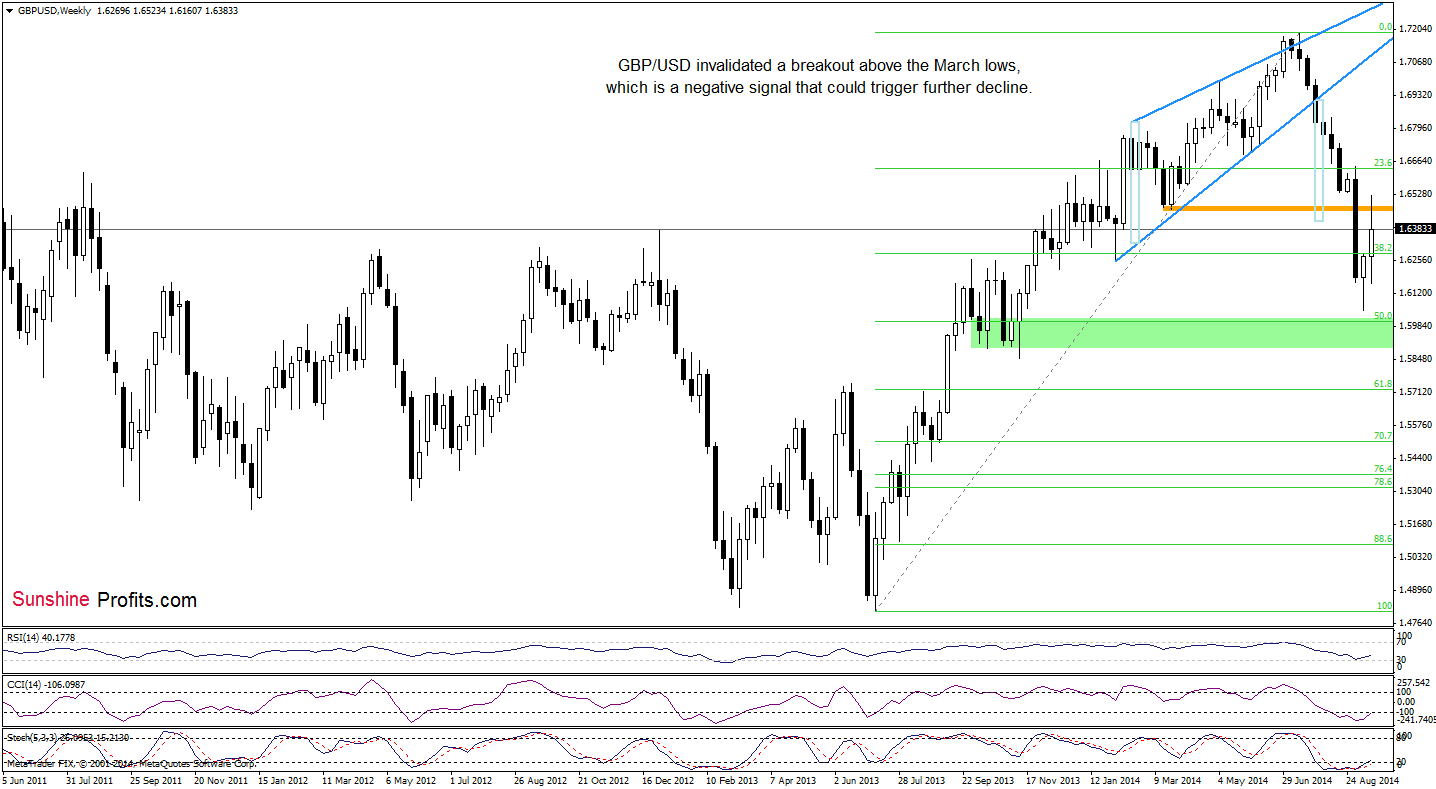
(…) GBP/USD closed (…) bearish formation, which triggered further improvement and an increase above the 23.6% Fibonacci retracement (based on the entire Jul-Sep decline). This is a positive signal, which suggests a rally to the next resistance zone around 1.6479, where the March low meets the 38.2% Fibonacci retracement. At this point, it’s worth noting that the current position of the indicators supports this pro-growth scenario.
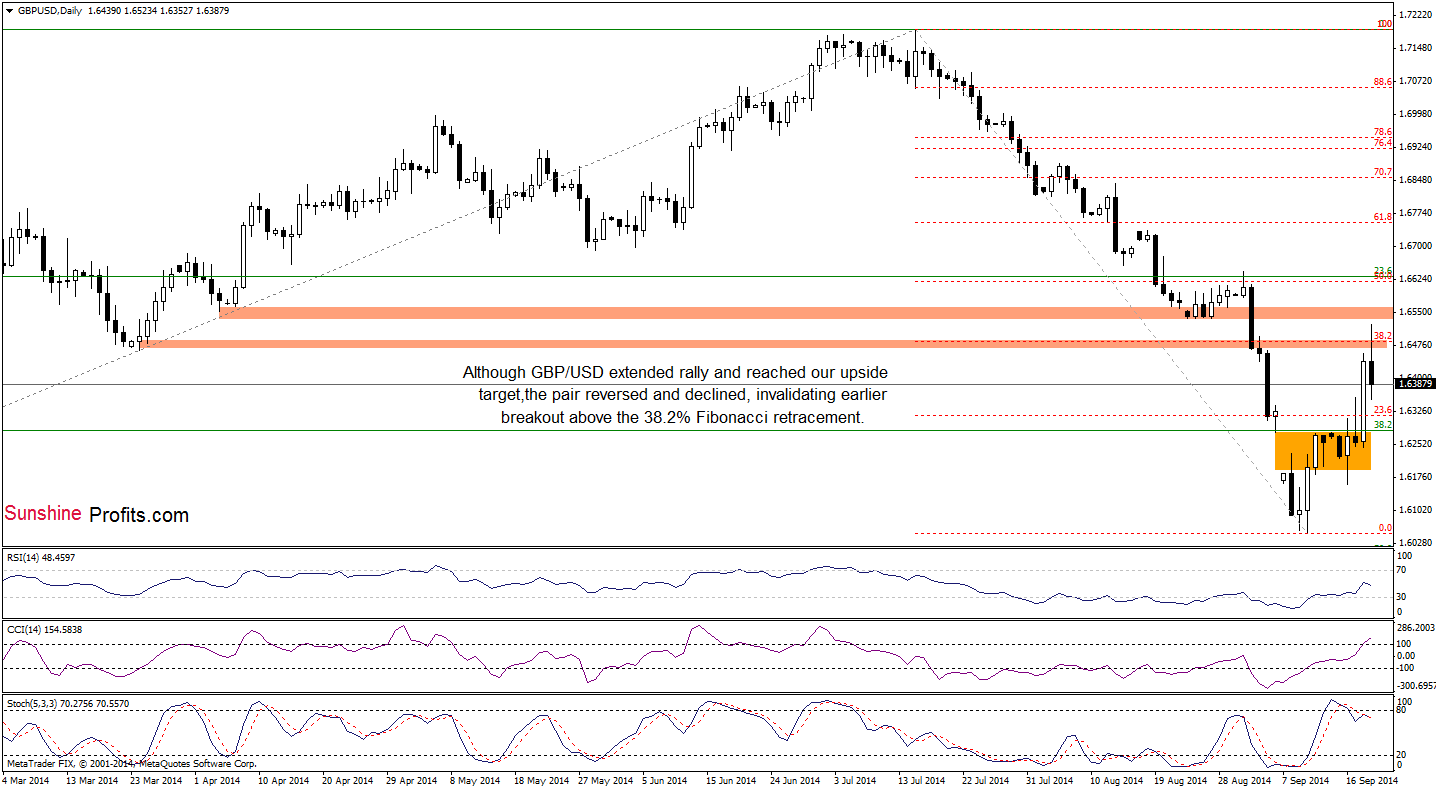
Looking at the above charts, we see that the situation developed in line with the above-mentioned scenario and the exchange rate reached our upside target. Despite this improvement, the pair reversed and declined, invalidating earlier breakout above these levels. This is a bearish signal, which suggests further deterioration and a drop to around 1.6280, where the Sep 5 low is. Please note that the Stochastic Oscillator generated a sell signal, supporting the bearish case.
Very short-term outlook: bearish
Short-term outlook: mixed
MT outlook: mixed
LT outlook: mixed
Trading position (short-term): In our opinion, no positions are justified from the risk/reward perspective. We will keep you informed should anything change, or should we see a confirmation/invalidation of the above.
USD/JPY
Yesterday, we wrote the following:
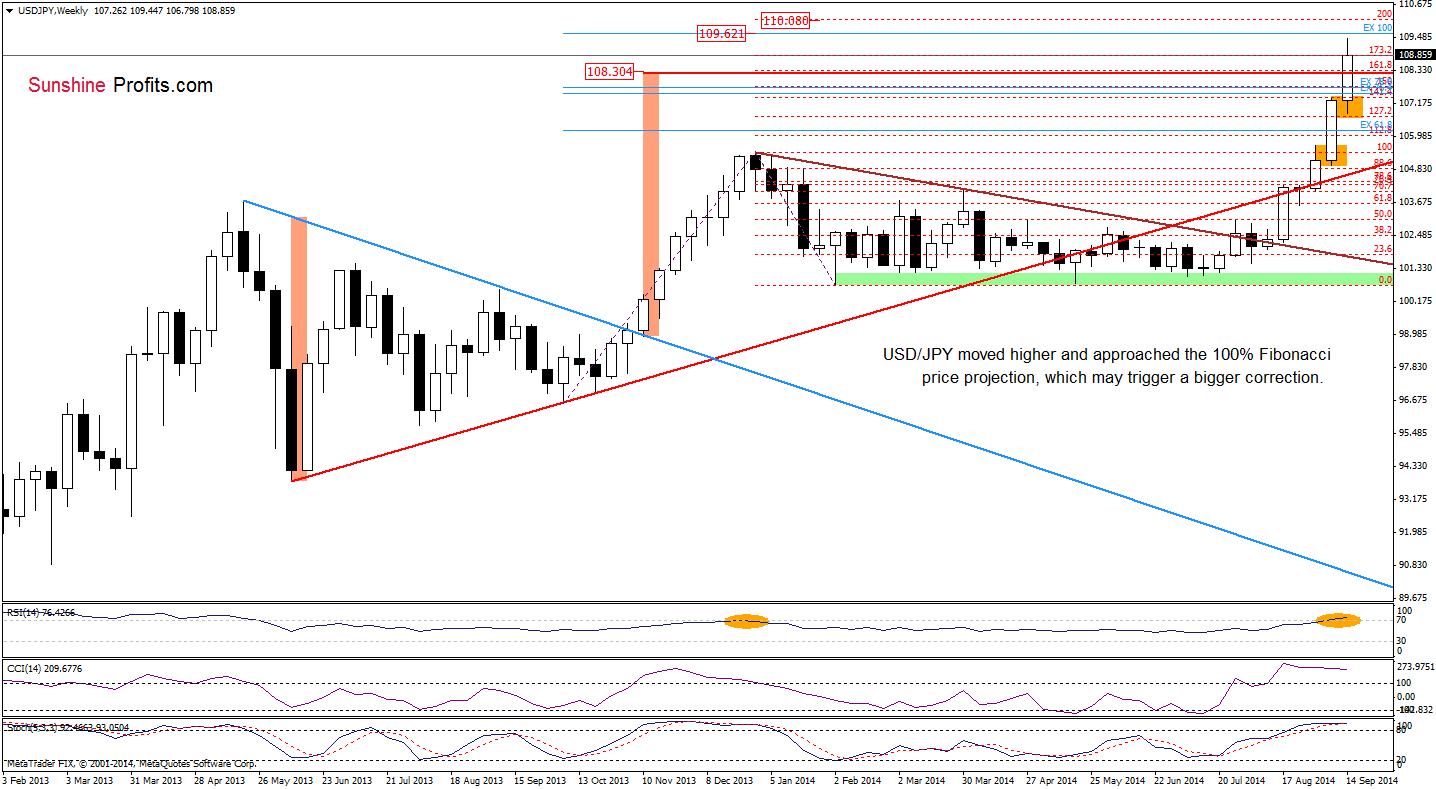
(…) if USD/JPY breaks above the 2014 high, the next upside target would be around 109.62, where the 100% Fibonacci price projection (based on the Oct and Feb lows and Dec high) is.
(…) please note that RSI climbed to its highest level since Dec, while the CCI and Stochastic Oscillator are overbought (there are also negative divergences between them and the exchange rate), which prescribe (…) because such position of the indicators suggests that a pause or bigger correction is just around the corner.
As you see on the weekly chart, USD/JPY extended rally and approached our upside target, hitting a fresh 2014 high of 109.45. Despite this improvement, the pair gave up some gains and came back to the previously-broken 173.2% Fibonacci extension. What’s next? Let’s examine the daily chart and look for more clues about future moves.
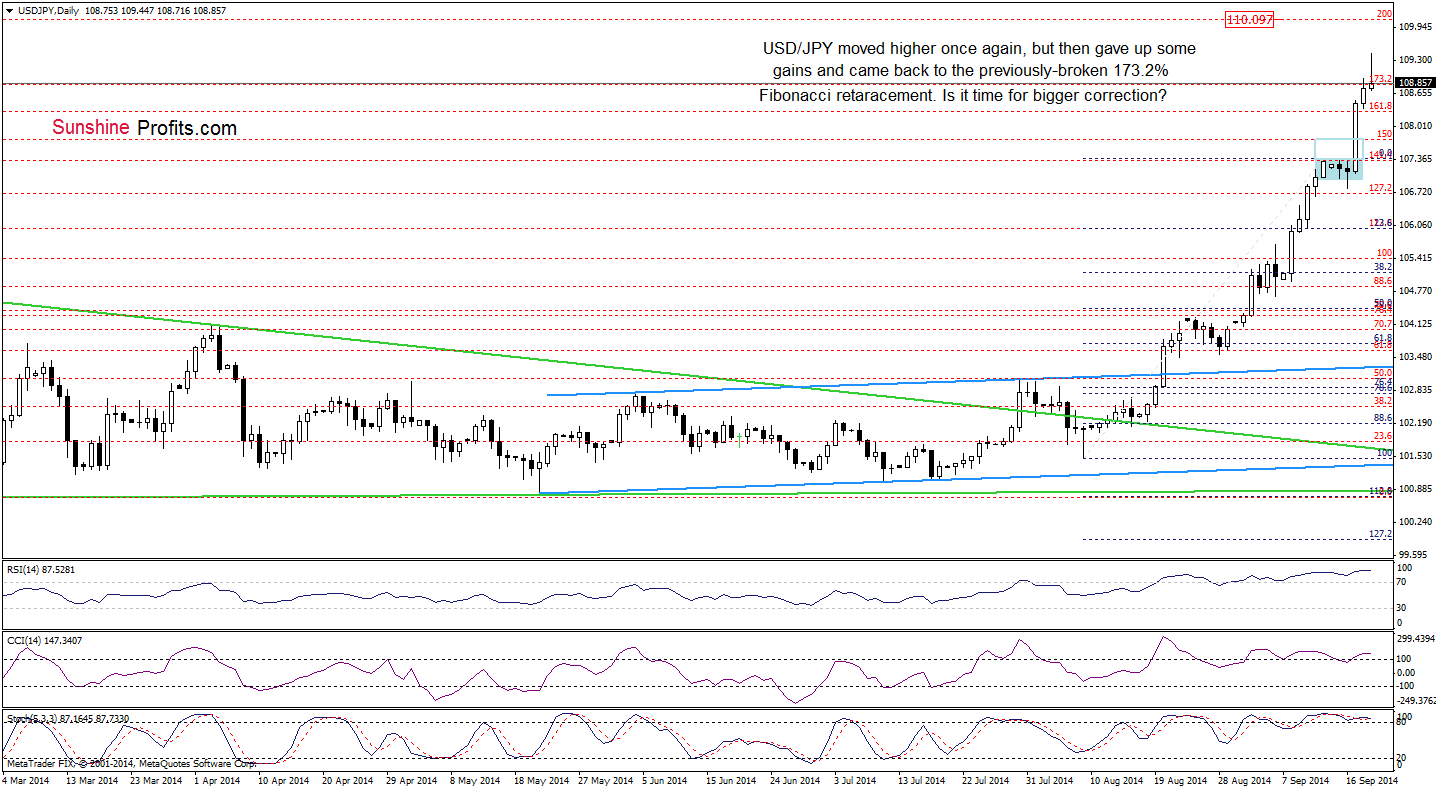
The firth thing that catches the eye on the above chart is an invalidation of a breakout above the recent high. Although this is a bearish signal, the pair is still trading very close to this level, which suggests that another attempt to move higher can’t be ruled out. Nevertheless, we should keep in mind that there are clearly visible negative divergences between the CCI, Stochastic Oscillator and the exchange rate (they are also all overbought), which suggests that correction is just around the corner. If this is the case, initial downside target would be around 107.55, where the 23.6% Fibonacci retracement based on the Aug-Sep rally is.
Very short-term outlook: mixed
Short-term outlook: mixed
MT outlook: mixed
LT outlook: bearish
Trading position (short-term): In our opinion no positions are justified from the risk/reward perspective at the moment. We will keep you informed should anything change, or should we see a confirmation/invalidation of the above.
Thank you.
Nadia Simmons
Forex & Oil Trading Strategist
Przemyslaw Radomski, CFA
Founder, Editor-in-chief
Gold & Silver Trading Alerts
Forex Trading Alerts
Oil Investment Updates
Oil Trading Alerts
