
Forex Trading Alert originally sent to subscribers on August 28, 2014, 12:35 PM.
Earlier today, Australia's second quarter private new capex (capital expenditure) data showed a gain of 1.1%, beating expectations for a 0.3% quarter-on-quarter fall. Thanks to these bullish numbers, AUD/USD extended gains and broke above the nearest resistance levels. How much more room to rally does the exchange rate have?
In our opinion the following forex trading positions are justified - summary:
EUR/USD
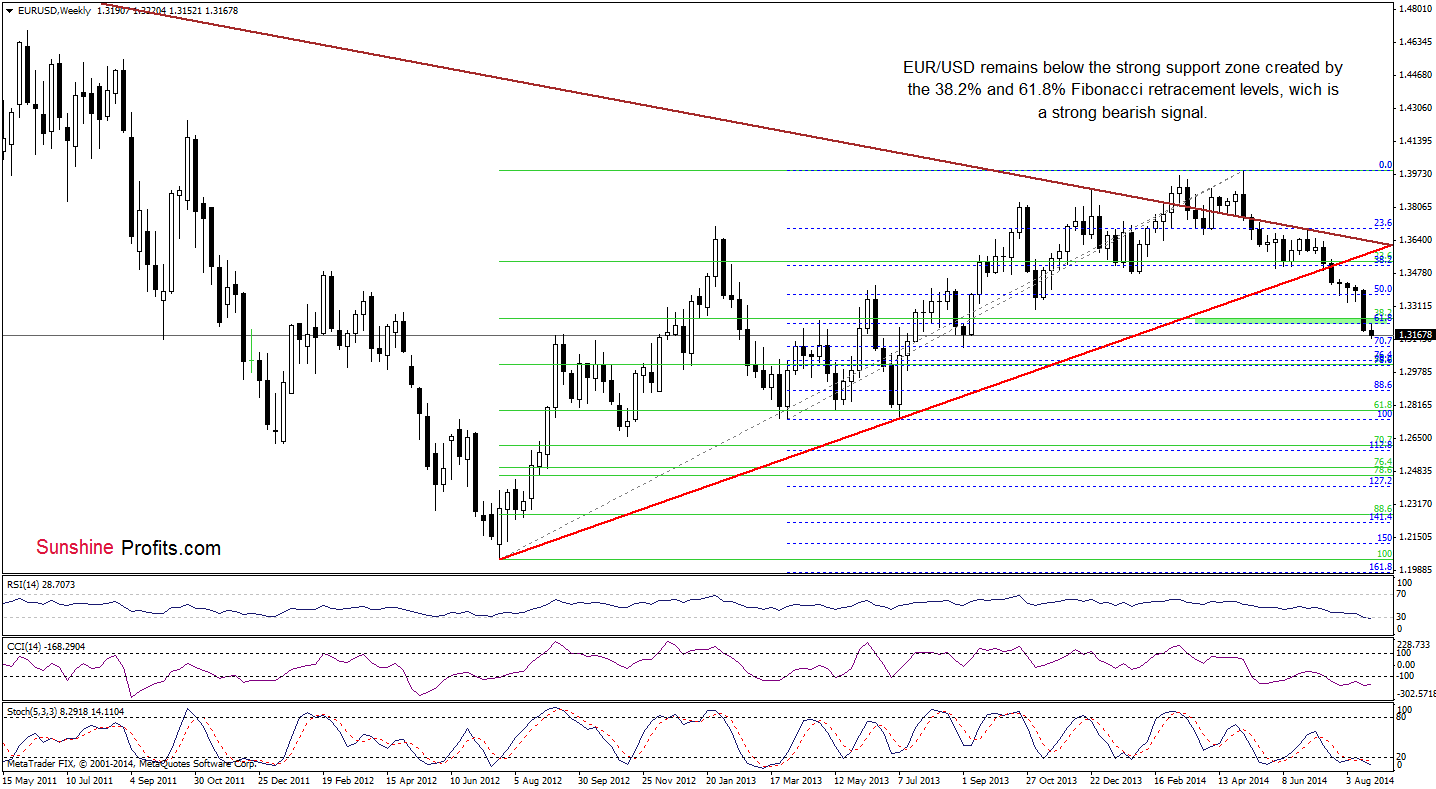
The medium-term picture hasn’t changed much as EUR/USD is still trading below the strong support/resistance zone created by the 38.2% and 61.8% Fibonacci retracement levels. Therefore, what we wrote on Monday is up-to-date:
(…) This is a strong bearish signal, which suggests further deterioration and a drop to around 1.3104-1.3109, were the 70.7% Fibonacci retracement meets the September low. (…) although the RSI declined to its lowest level since July 2012 (while the CCI and Stochastic Oscillator are oversold) suggesting a pause or corrective upswing, we should keep in mind that as long as there is no invalidation of the breakdown below the green area, another attempt to move lower can’t be ruled out.
What can we infer from the very short-term picture? Let’s check.
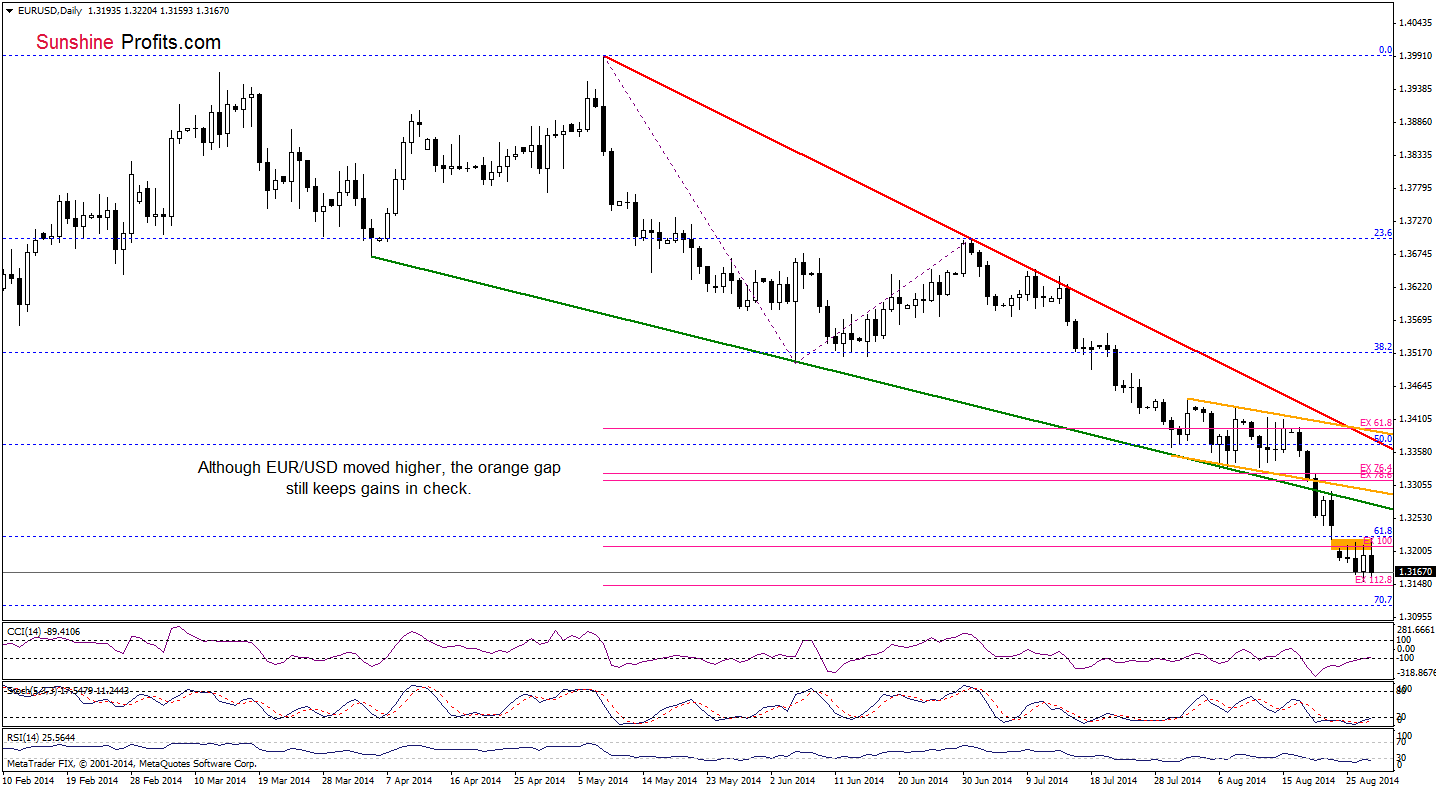
From this perspective, we see that although EUR/USD moved higher earlier today, the orange gap successfully stopped further improvement. As a result, the exchange rate reversed and declined, which suggests that the pair will test the strength of the recent lows. If this area withstands the selling pressure, we’ll see a rebound and another attempt to break above the orange gap. However, if it is broken, the next downside target for currency bears will be around 1.3109, where the 70.7% Fibonacci retracement is. At this point, it’s worth noting that all three indicators generated buy signals. This is a positive sign, which suggests that a trend reversal is just around the corner.
Very short-term outlook: mixed
Short-term outlook: mixed
MT outlook: mixed
LT outlook: bearish
Trading position (short-term): In our opinion no positions are justified from the risk/reward perspective. We will keep you informed should anything change, or should we see a confirmation/invalidation of the above.
USD/JPY
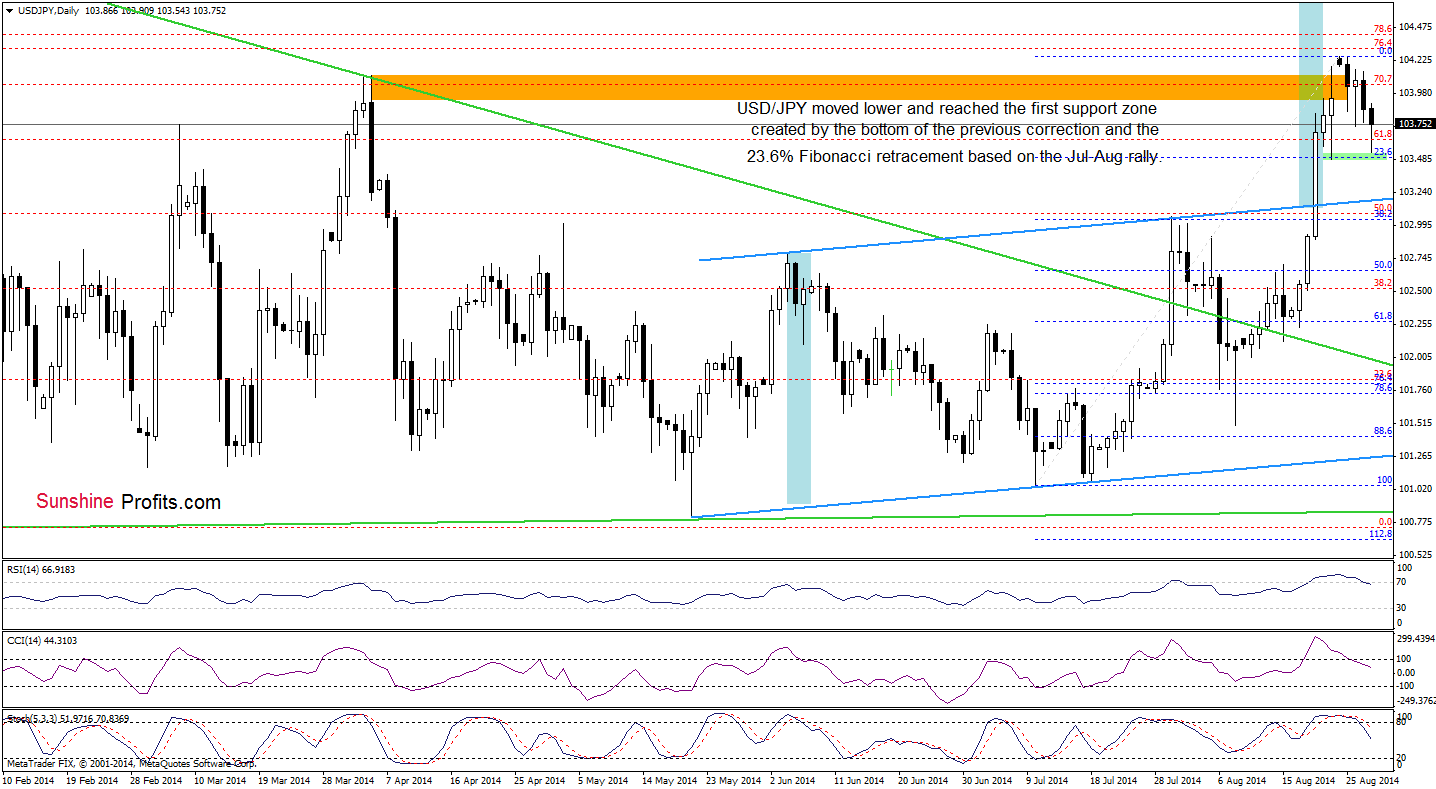
The medium-term picture hasn’t changed much as USD/JPY still remains slightly below the previously-broken resistance zone created by the long-term red resistance line and the 70.7% Fibonacci retracement. Today, we’ll focus on the very short-term changes.
Quoting our last commentary on this currency pair:
(…) the pair reversed and dropped below the orange resistance zone, invalidating earlier breakout. Taking this bearish signal into account, and combining it with the current position of the indicators (the RSI remains above the level of 70, while the CCI and Stochastic Oscillator are overbought and very close to generate sell signals), it seems to us that the next move will be to the downside.
Looking at the above chart, we see that the situation developed in line with the above-mentioned scenario as USD/JPY extended losses and reached its first support area created by the bottom of the previous pullback and the 23.6% Fibonacci retracement based on the Jul-Aug rally. This is the point where we usually consider two scenarios. On one hand, if it holds, we’ll see a rebound and a comeback to around the recent highs. On the other hand, if currency bears do not give up and push the pair lower, the next target will be the previously-broken upper line of the rising trend channel (currently around 103.17), which is reinforced by the 38.2% Fibonacci retracement. Which scenario is more likely at the moment? Taking into account the current position of the indicators, we still think that the next move will be to the downside.
Very short-term outlook: mixed with bearish bias
Short-term outlook: mixed with bearish bias
MT outlook: mixed
LT outlook: bearish
Trading position (short-term): In our opinion no positions are justified from the risk/reward perspective at the moment. We will keep you informed should anything change, or should we see a confirmation/invalidation of the above.
AUD/USD
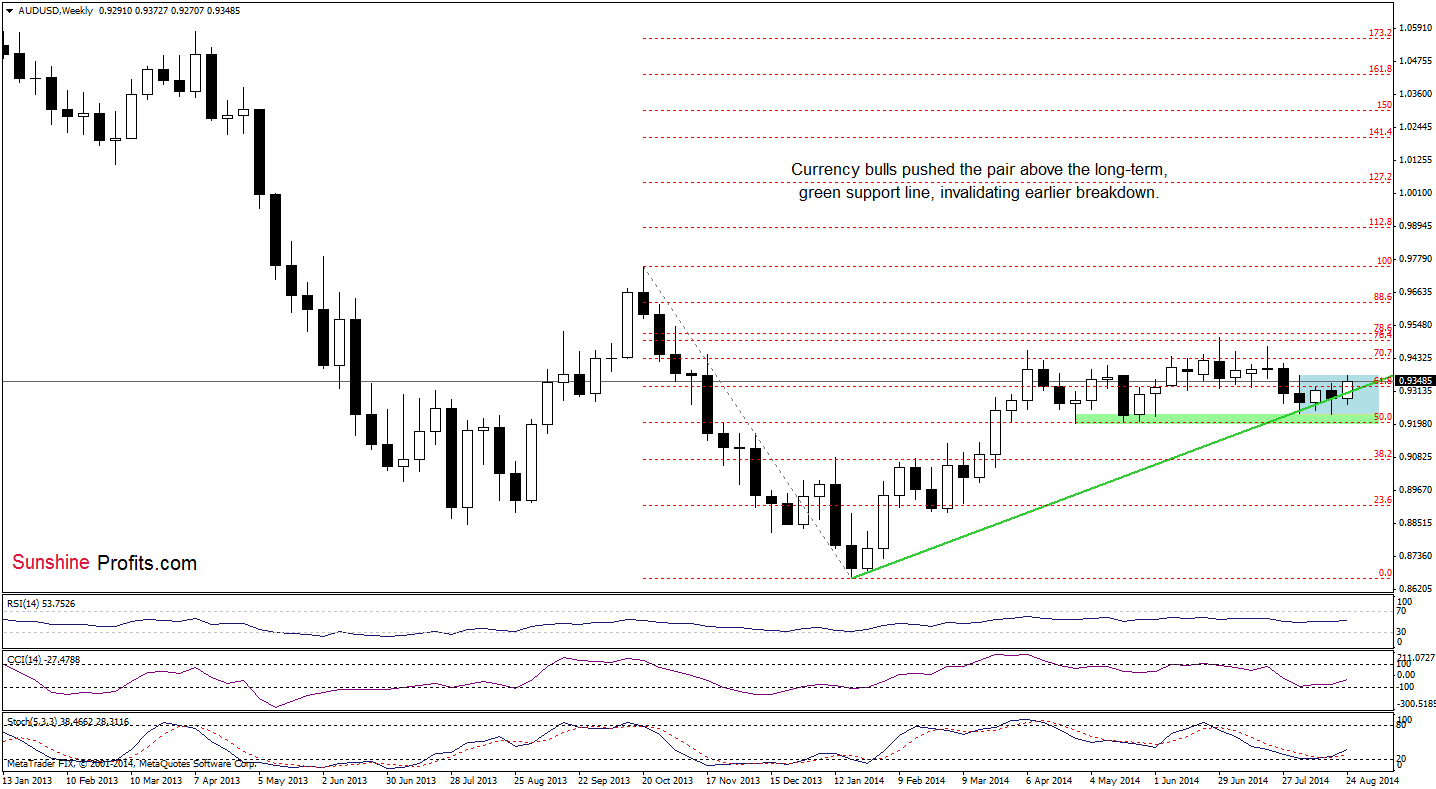
The medium-term picture has improved as AUD/USD moved higher and reched the Aug high, which creates the upper border of the consolidation (marked with blue). Although this resistance level could stop further improvement (and trigger a pullback to the previously-broken long-term green support line), it seems to us that buy signals generated by the CCI and Stochastic Oscillator will encourage currency bulls to act. If this is the case, the exchange rate will rally to the 2014 high of 0.9503.
Are there any short-term resistance levels that could stop the rally? Let’s check.
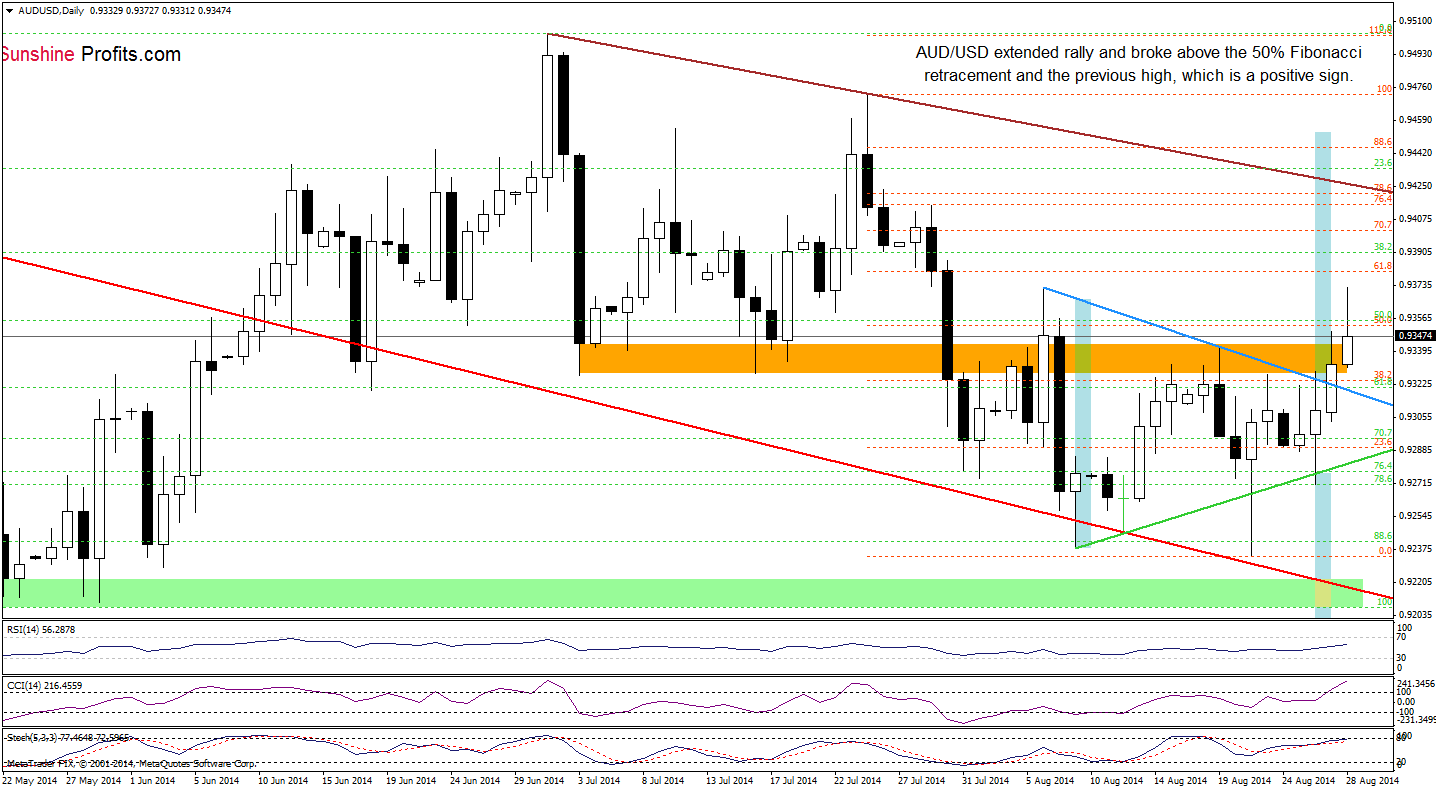
From this perspective, we see that AUD/USD moved higher once again and broke above the orange resistance zone and the 50% Fibonacci retracement, which is a strong bullish signal that suggests further improvement. Therefore, what we wrote yesterday is up-to-date:
(…) If the exchange rate breaks above the orange resistance line, we may see an increase to at least the brown declining resistance line (which is currently reinforced by the 76.4% and 78.6% Fibonacci retracements).
Please note that despite this improvement, we should keep an eye on the current position of the indicators. As you see, the CCI and Stochastic Oscillator are quite high, which suggests that if they generate sell signals, currency bulls may have a problem with a realization of the above-mentioned scenario.
Very short-term outlook: bullish
Short-term outlook: mixed with bullish bias
MT outlook: mixed
LT outlook: bearish
Trading position (short-term): In our opinion, no positions are justified from the risk/reward perspective. We will keep you informed should anything change, or should we see a confirmation/invalidation of the above.
Thank you.
Nadia Simmons
Forex & Oil Trading Strategist
Przemyslaw Radomski, CFA
Founder, Editor-in-chief
Gold & Silver Trading Alerts
Forex Trading Alerts
Oil Investment Updates
Oil Trading Alerts
