
Forex Trading Alert originally sent to subscribers on July 22, 2014, 1:33 PM.
Earlier today, official data showed that the annual rate of U.S. inflation was at 1.2% in the previous month, while core inflation (without food and energy costs) increased by just 0.1% month-on-month and U.S. consumer prices were up 0.3%. On top of that, U.S. existing home sales increased 2.6%, while analysts had expected an increase of 2%. Thanks to these bullish numbers, the common currency declined against the U.S dollar to a 8-month low. What are the implications of this event?
In our opinion the following forex trading positions are justified - summary:
- EUR/USD: short (stop-loss order: 1.3670)
- GBP/USD: none
- USD/JPY: none
- USD/CAD: none
- USD/CHF: none
- AUD/USD: none
EUR/USD
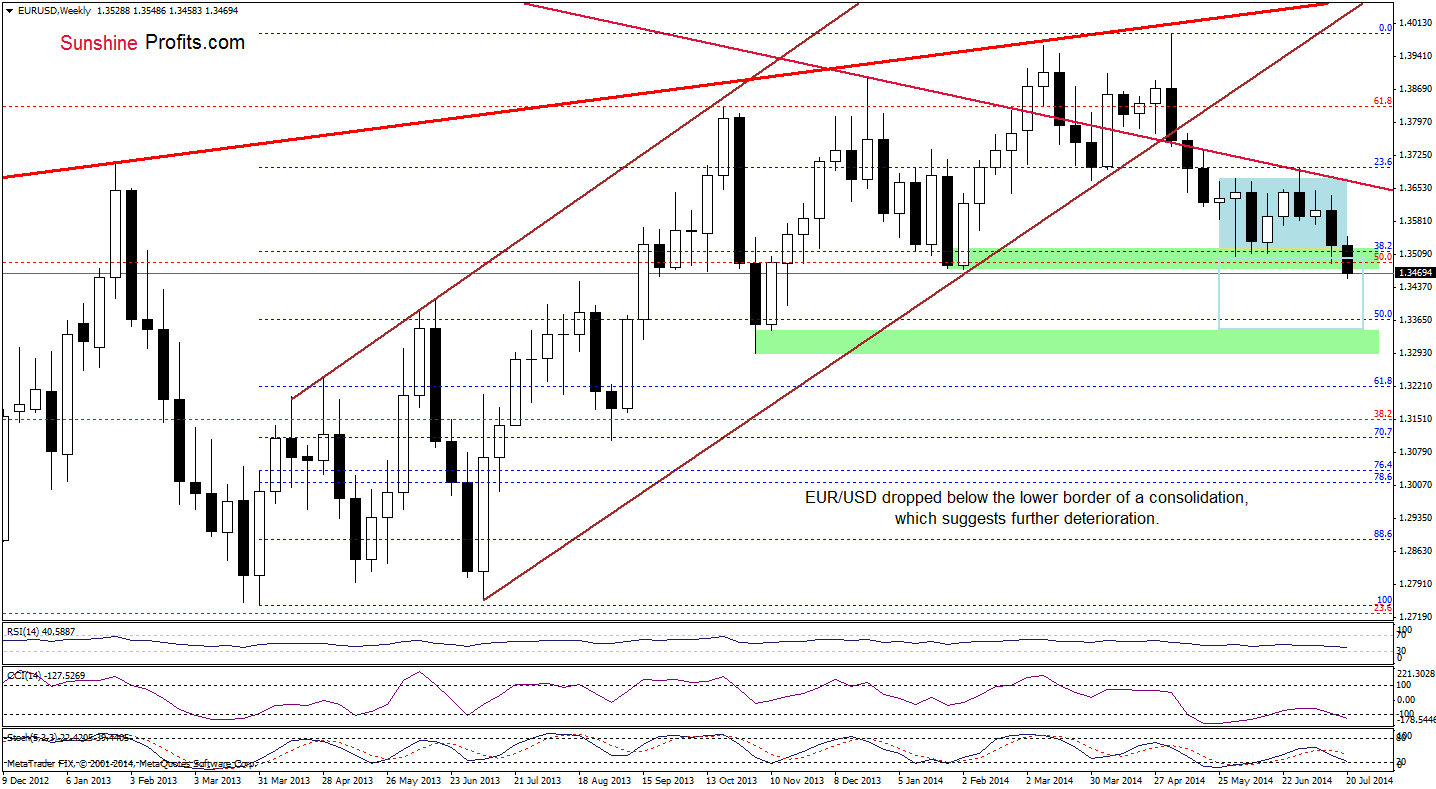
The medium-term picture has deteriorated significantly as EUR/USD declined not only below the lower border of the consolidation, but also under the February lows. Taking these bearish circumstances into account, we are convinced that our bearish scenario from the Friday’s Forex Trading Alert is up-to-date:
(…) if currency bulls fail and the pair moves lower, we may see a drop even to around 1.3320, where the size of the downswing will correspond to the height of the consolidation.
Please keep in mind that before currency bears will be able to realize the above-mentioned scenario, they will have to break below the 50% Fibonacci retracement level (around 1.3367), which serves as the nearest medium-term support at the moment.
Having discussed the medium-term outlook, let’s check the daily chart.
Yesterday, we wrote the following:
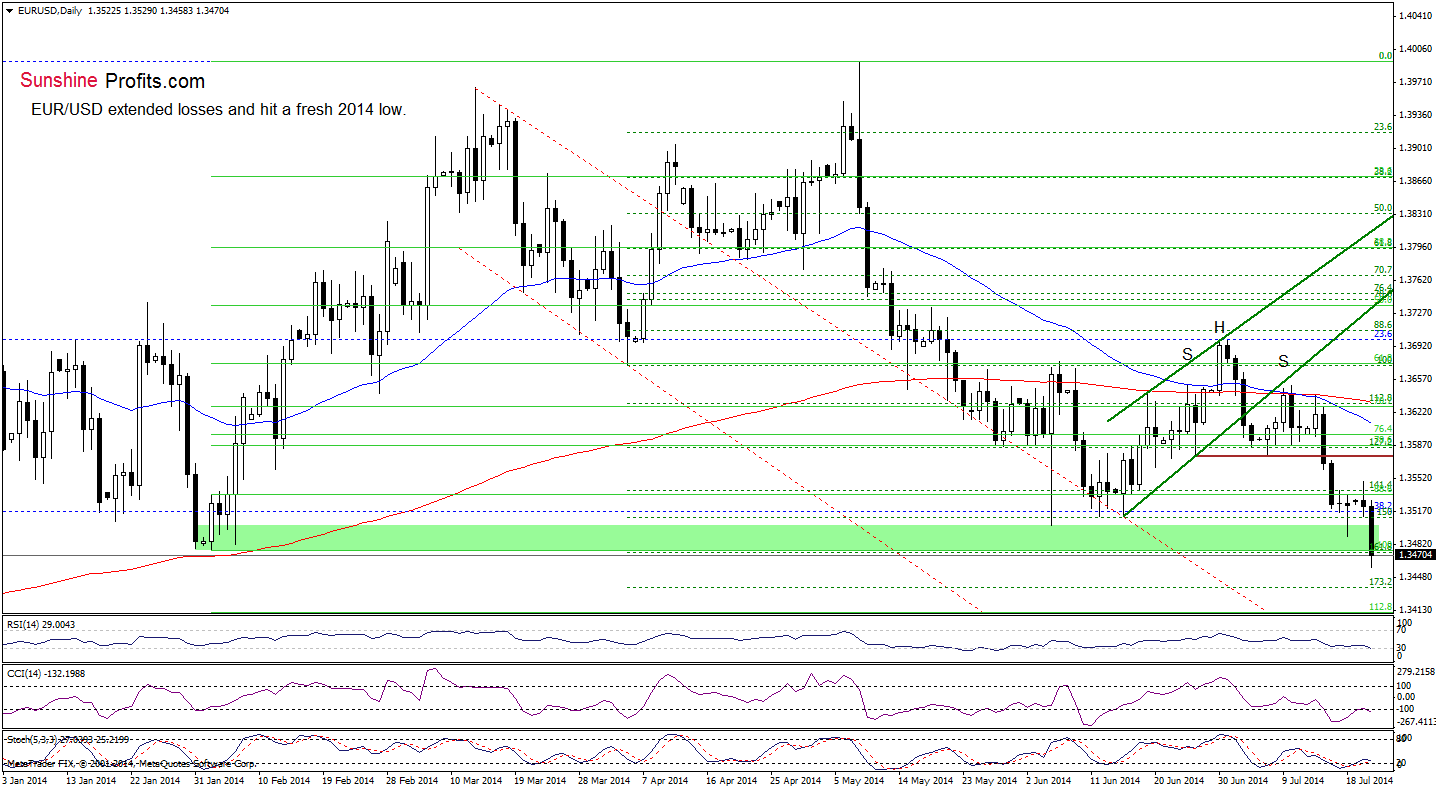
(…) EUR/USD is still trading in a narrow range, slightly above the June lows. (…) If this area (…) is broken, the next target for currency bears will be around 1.3476, where the February low is.
Looking at the above chart, we see that the situation in the very short-term developed in tune with the above-mentioned scenario as the exchange not only reached our downside target, but also slipped below it. What’s next? From this perspective, we see that the RSI dropped to its lowest level since mid-June, while the CCI and Stochastic Oscillator are oversold (additionally, there are positive divergences between these two indicators and the pair), which suggests that a pause or corrective upswing is just around the corner (on the short-term basis). Nevertheless, as long as there are no buy signals and EUR/USD remains below the recent lows, another move lower is more likely than not. If this is the case, the nearest support will be around 1.3436 (the 1.732% Fibonacci extension based on the April-May rally), and if it is broken, the pair will likely drop to 1.3411, where the 112.8% Fibonacci extension (based on the entire Feb-May rally) is.
Very short-term outlook: bearish
Short-term outlook: bearish
MT outlook: bearish
LT outlook: bearish
Trading position (short-term): Small short positions (using half of the capital that one would normally use). Stop-loss order: 1.3670. The probability for the continuation of the decline is not extremely high, which is why we are not doubling the short position at the moment. We’ll do it, when the breakdown is confirmed. We will keep you informed should anything change, or should we see a confirmation/invalidation of the above.
USD/CHF
On Friday, we wrote:
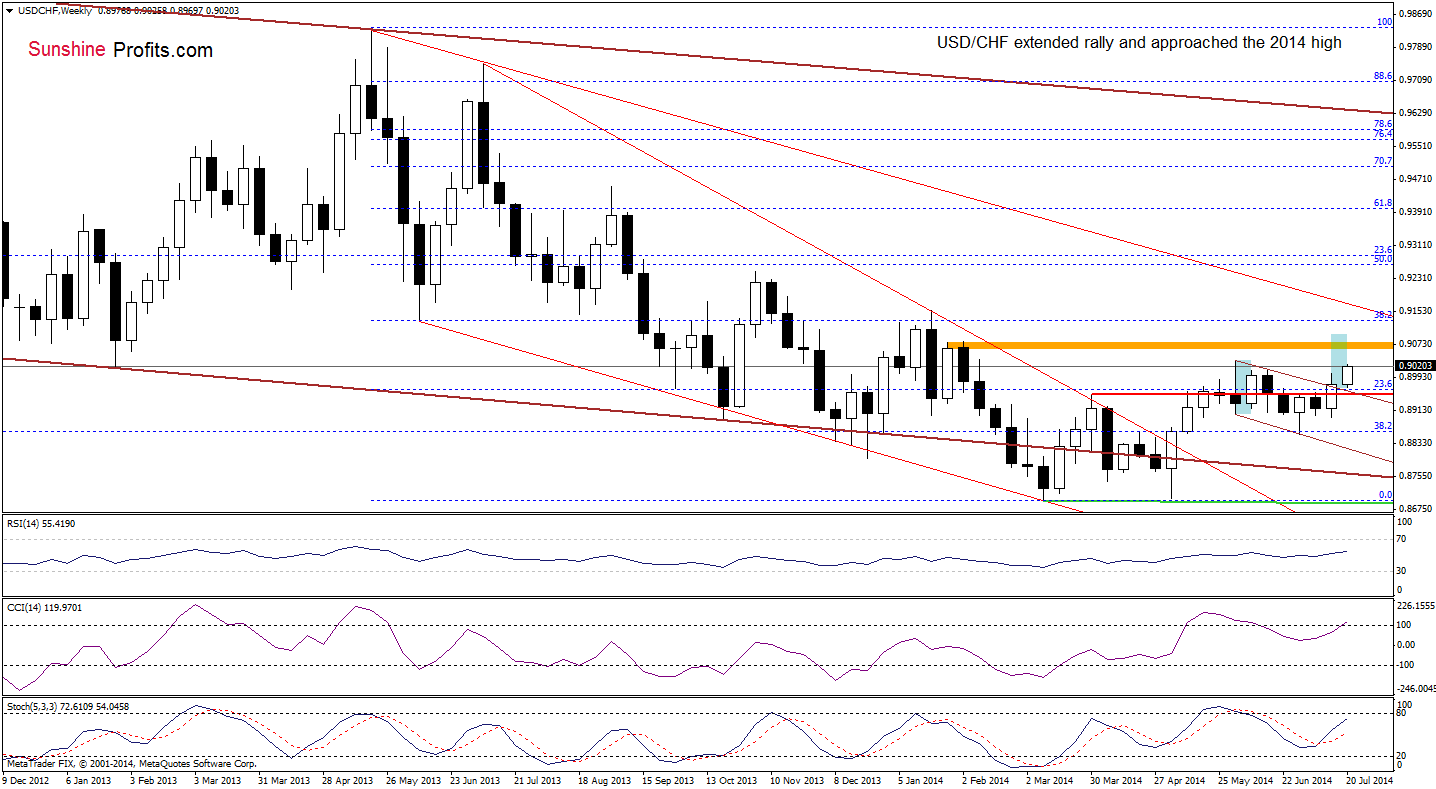
(…) USD/CHF came back above the April high and the 23.6% Fibonacci retracement. With this upswing, the pair also broke above the upper line of the declining trend channel, which suggests further improvement and an increase to at least recent highs.
As you see on the above chart, although currency bulls didn’t realize the above-mentioned scenario yet, it seems that this week rally will take the pair to (at least) its upside target. Please note that if, it is broken, the exchange rate will likely test the strength of the next resistance zone (marked with orange) around 0.9080. Are there any short-term factors that could stop further improvement? Let’s check.
Quoting our last commentary on this currency pair:
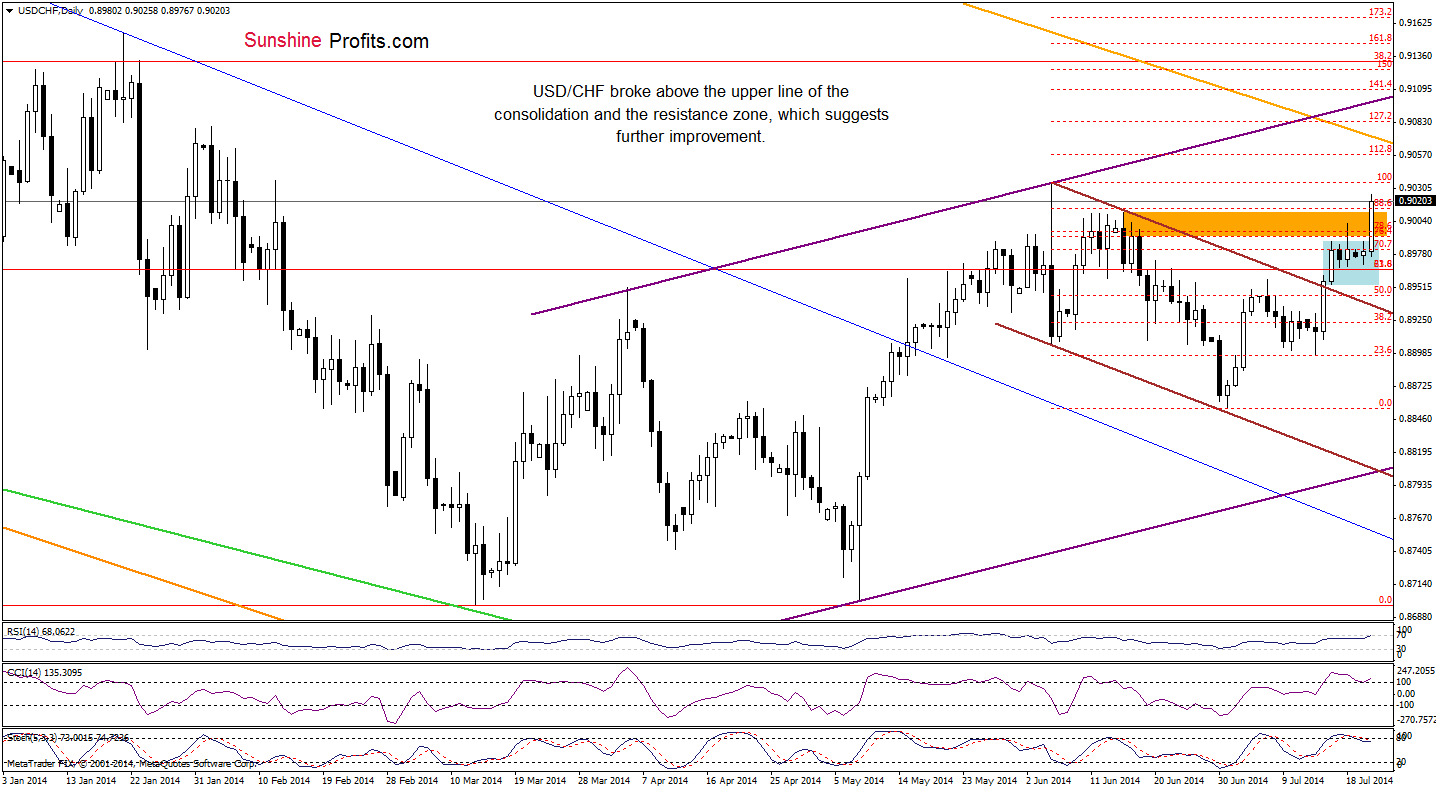
(…) USD/CHF paused after a breakout above the upper line of the declining trend channel and remains in a consolidation. If the pair moves higher, we’ll see a test of the strength of the resistance zone created by mid-June highs and the 76.4% and 78.6% Fibonacci retracement levels (marked with orange). In our opinion, only if this area is broken, we’ll see an increase to around the 2014 high.
Looking at the daily chart, we see that the above-mentioned resistance was broken, and it seems that there is nothing that could stop currency bulls before a test of the strength of the annual high. Will the pair move above it? Based only on the recent candlesticks, further improvement is more likely than not. However, when we factor in the current position of the indicators (the RSI reached its highest level since the beginning of June, while the CCI is overbought and the Stochastic Oscillator generated a sell signal), the very short-term picture is not so bullish and suggests that a pause or correction is just around the corner.
Very short-term outlook: mixed
Short-term outlook: mixed
MT outlook: mixed with bullish bias
LT outlook: bearish
Trading position (short-term): In our opinion no positions are justified from the risk/reward perspective. We will keep you informed should anything change, or should we see a confirmation/invalidation of the above.
AUD/USD
The medium-term outlook remains mixed as AUD/USD is still trading in a consolidation slightly below the 2014 high. Will the very short-term picture give us more learly clues where the pair head next? Let’s check.
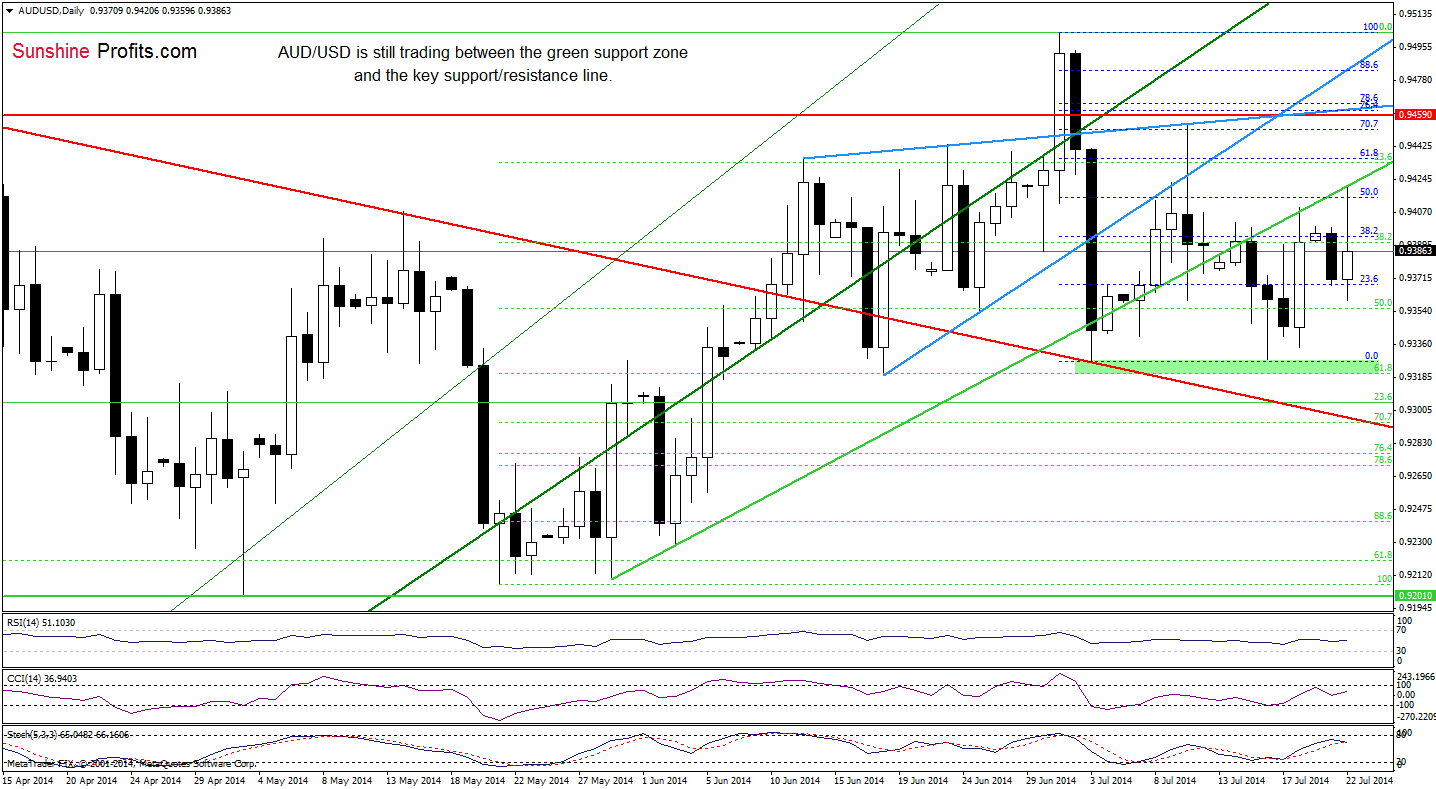
From this perspective, we see that AUD/USD moved higher, but the green support/resistance line stopped further improvement once again. Taking this event into account, we believe that what we wrote yesterday is still valid:
(…) AUD/USD has been trading between the green support zone and the support/resistance line recently. Although both, the bulls and the bears, have tried to push the exchange rate above/below these key levels, none of them managed to hold gained levels and the pair has fluctuated in a quite narrow range. So, what’s next? (…) as long as there is no breakout above the major resistance (or breakdown under the key support), another sizable move is not likely to be seen.
Very short-term outlook: mixed
Short-term outlook: mixed
MT outlook: mixed
LT outlook: bearish
Trading position (short-term): In our opinion, no positions are justified from the risk/reward perspective. We will keep you informed should anything change, or should we see a confirmation/invalidation of the above.
Thank you.
Nadia Simmons
Forex & Oil Trading Strategist
Przemyslaw Radomski, CFA
Founder, Editor-in-chief
Gold & Silver Trading Alerts
Forex Trading Alerts
Oil Investment Updates
Oil Trading Alerts
