
Free Forex Trading Alert originally sent to subscribers on January 21, 2014, 12:50 PM.
Earlier today, the U.S. dollar moved higher against the euro after worse-than-expected data from Germany. The U.S. currency also appreciated against the Swiss franc and the yen, while the pound erased the gains against the greenback after data showed that British factory orders fell in January. Meanwhile, the U.S. dollar rose to the highest level since September 2009 against its Canadian counterpart as expectations that the Fed will continue to scale back its stimulus program at the next policy meeting on January 29 to USD65 billion, from the current USD75 billion, weighed on the exchange rate. What impact did these moves have on major currency pairs? If you want to know our take on this question, we invite you to read our today's Forex Trading Alert.
Forex Trading Positions - Summary:
- EUR/USD: short position (stop-loss level: 1.3699)
- GBP/USD: short position (stop-loss level: 1.6515)
- USD/JPY: none
- USD/CAD: none
- USD/CHF: long position (stop-loss level: 0.8985)
- AUD/USD: none
EUR/USD
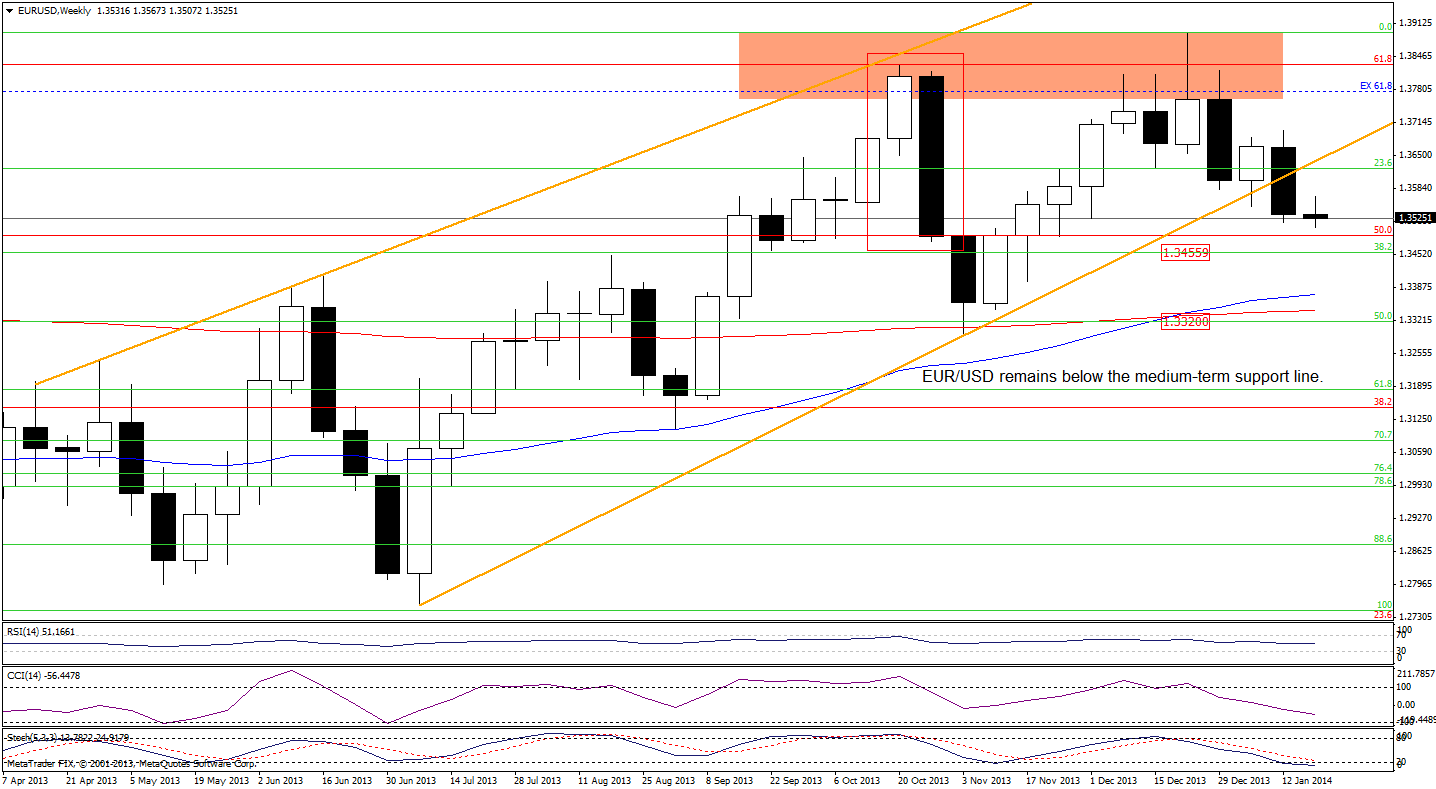
On the above charts, we see that despite yesterday’s increase, the situation hasn’t changed much as EUR/USD still remains below the previously-broken lower border of the consolidation range (marked in blue) and the medium-term support/resistance line.
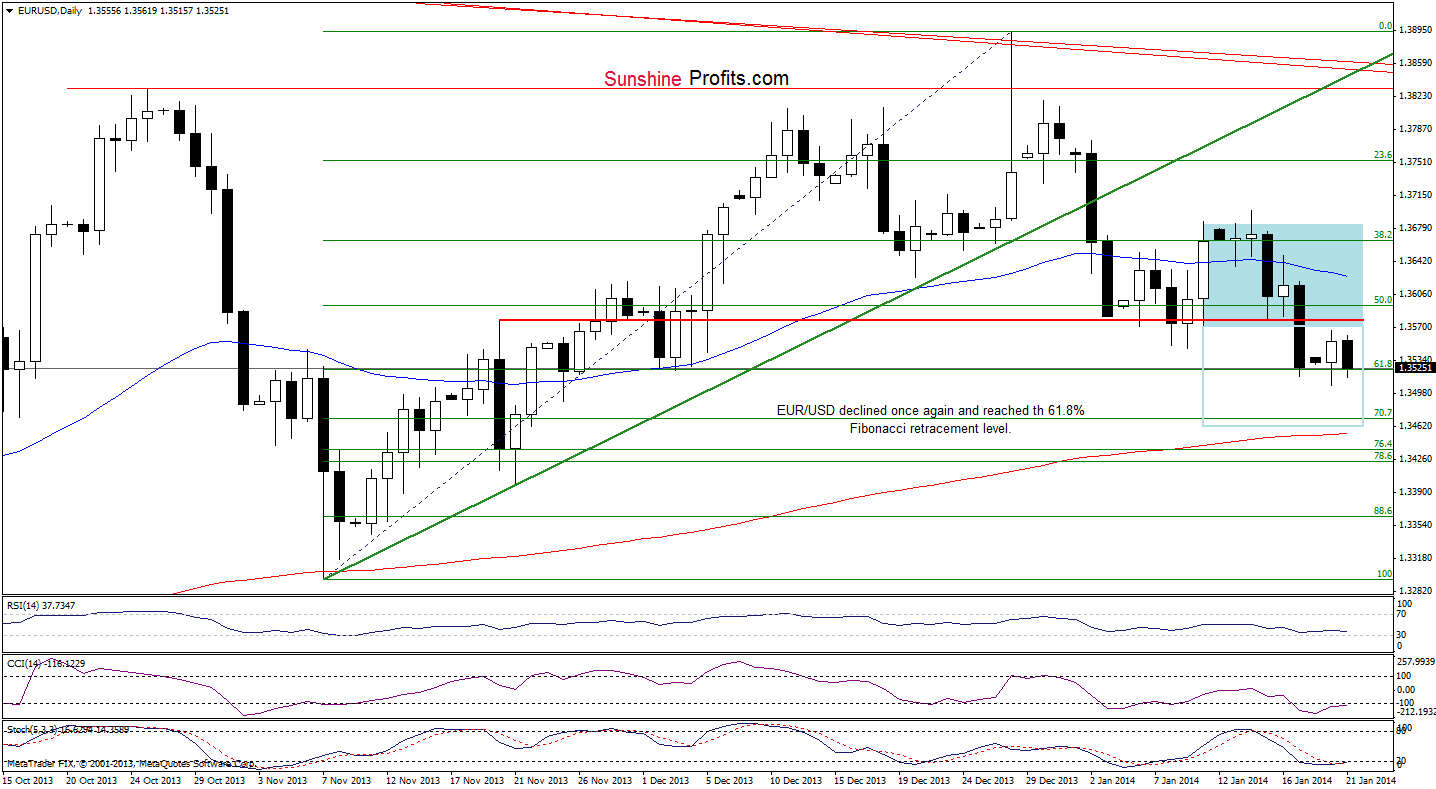
As you see on the daily chart, the proximity to these levels encouraged sellers to act, which triggered a downswing that took EUR/USD to the 61.8% Fibonacci retracement level once again. If this support level encourages buyers, we may see another attempt to come back above the lower border of the consolidation range. However, if it is broken, we will likely see further deterioration and the first downside target will be around 1.3457 (this level intersects with the 38.2% Fibonacci retracement level based on the entire March-December rally).
Please note that as long as the pair doesn’t invalidate the breakdowns below lower border of the consolidation range and medium-term support/resistance line, further deterioration is likely to be seen. Additionally, a bearish engulfing pattern created by Thursday’s and Friday’s candlesticks pattern still supports sellers.
Very short-term outlook: bearish Short-term outlook: bearish MT outlook: mixed with bearish bias LT outlook: bearish
Trading position (short-term): short. The stop-loss level for this position is at 1.3699. The first downside price target is around 1.3457. We will keep you informed should anything change, or should we see a confirmation/invalidation of the above.
GBP/USD
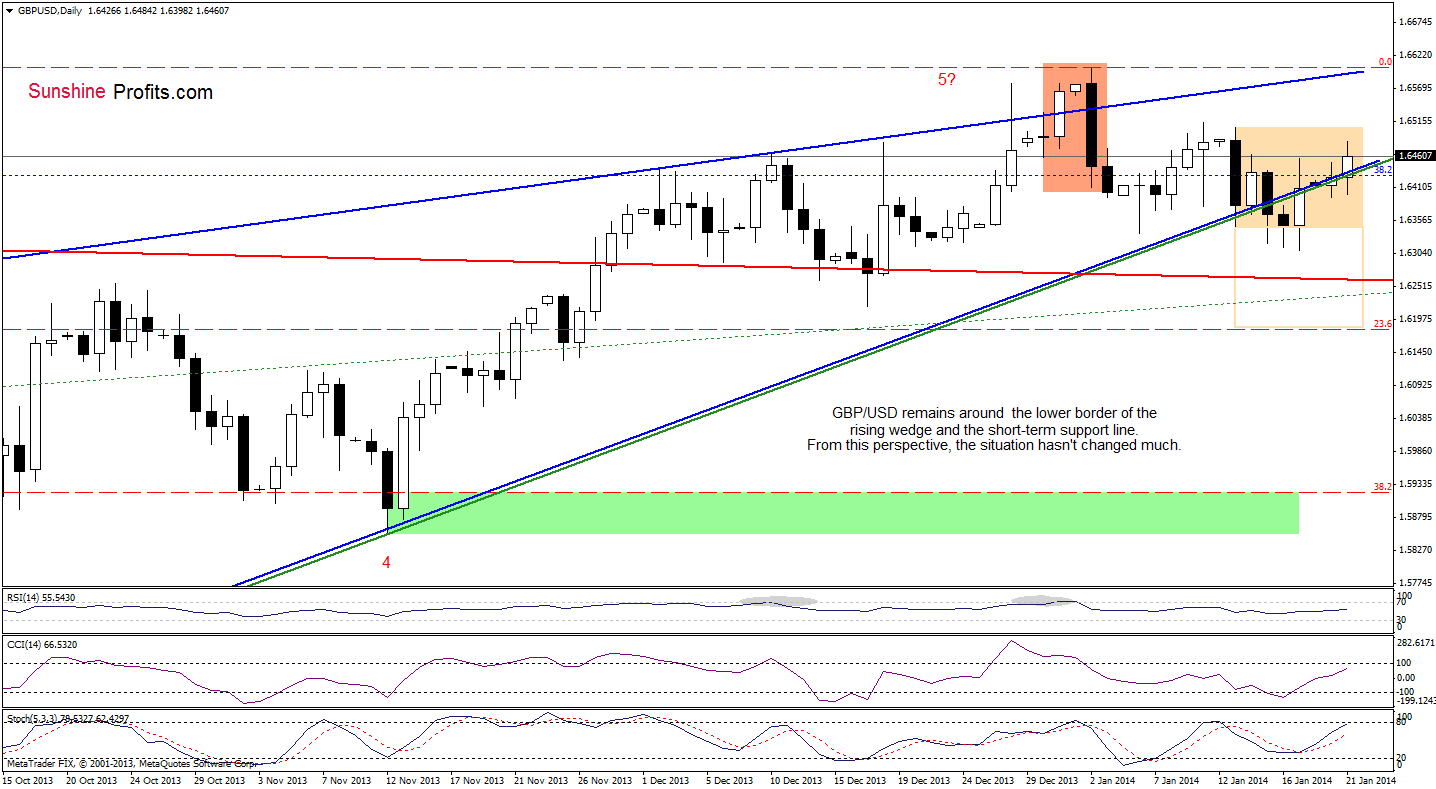
Looking at the above chart, we see that the situation hasn’t changed much. Although buyers tried to push GBP/USD higher yesterday (and also earlier today), their attempts failed and the pair still remains below the upper line of the consolidation range, which suggests that the sellers keep further gains in check. Therefore, as long as the pair remains below this resistance level, further deterioration is likely to be seen – especially if GBP/USD closes the day below the lower border of the rising wedge and the short-term declining support line once again.
As a reminder, the breakdown below lower border of the rising wedge and short-term declining support line has not been invalidated so far, which is a bearish sign.
Very short-term outlook: mixed Short-term outlook: mixed MT outlook: mixed LT outlook: mixed
Trading position (short-term): short. The stop-loss level for this position is at 1.6515. The first downside price target is around 1.6190. We will keep you informed should anything change, or should we see a confirmation/invalidation of the above.
USD/JPY
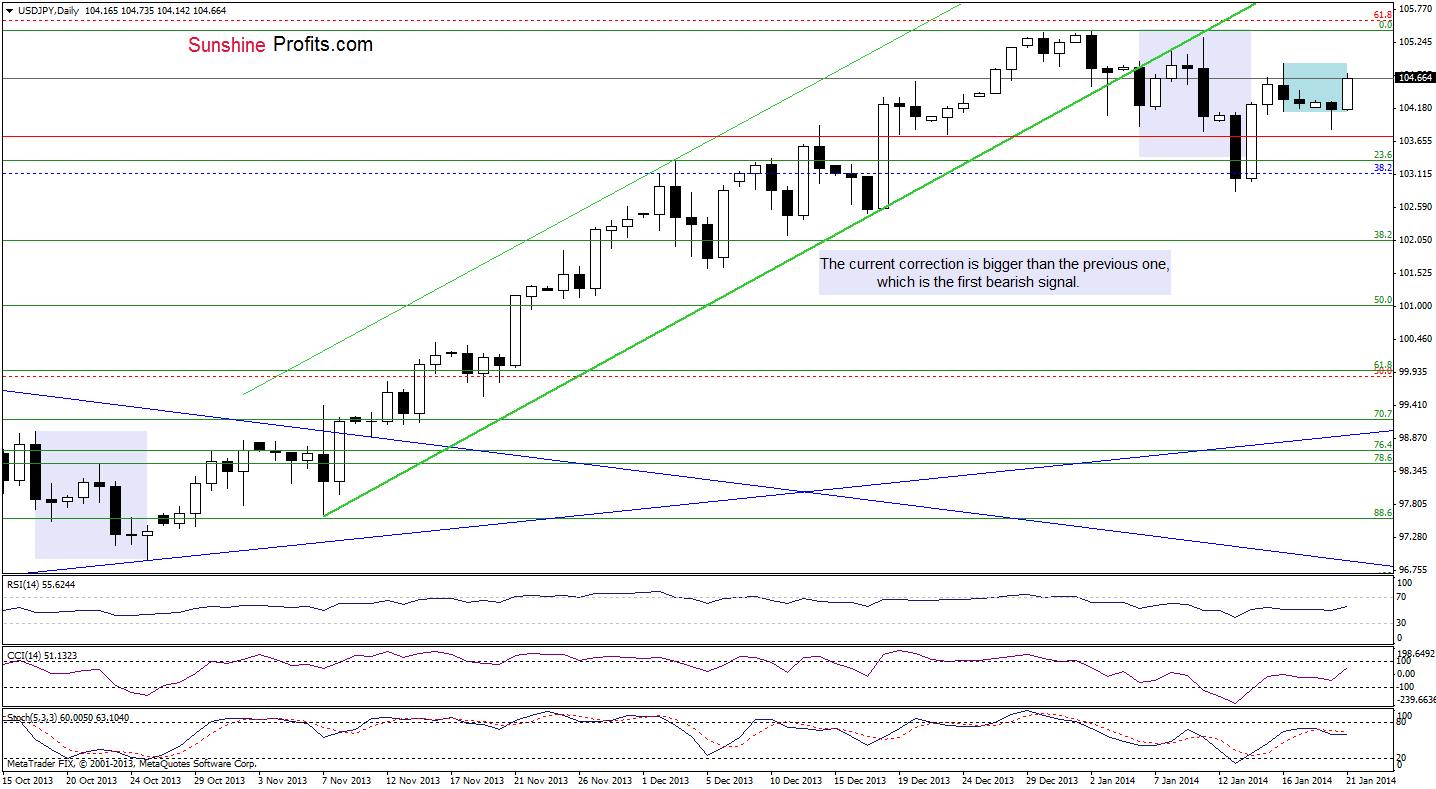
Yesterday, we wrote that recent days had formed a consolidation on the chart and the pair had broken below its lower border, which had triggered further deterioration. However, as it turned out, USD/JPY reversed in the following hours and not only came back to the consolidation range, but also climbed to slightly below Thursday’s high at 104.91. If this resistance level is broken, we will likely see another upswing to around the Jan. 10 high (or even to the annual peak). At this point, it’s worth noting that these levels are slightly below the 61.8% Fibonacci retracement level, which supports the sellers and successfully stopped further gains at the beginning of the year.
On the other hand, if the pair drops below yesterday’s low we will likely see further declines and the first downside target will be the January low at 102.84. Please note that the sell signal generated by the Stochastic Oscillator remains in place supporting sellers.
Very short-term outlook: mixed with bearish bias Short-term outlook: mixed MT outlook: bullish LT outlook: bearish
Trading position (short-term): we do not suggest opening any trading positions at the moment. We will keep you informed should anything change, or should we see a confirmation/invalidation of the above.
USD/CAD
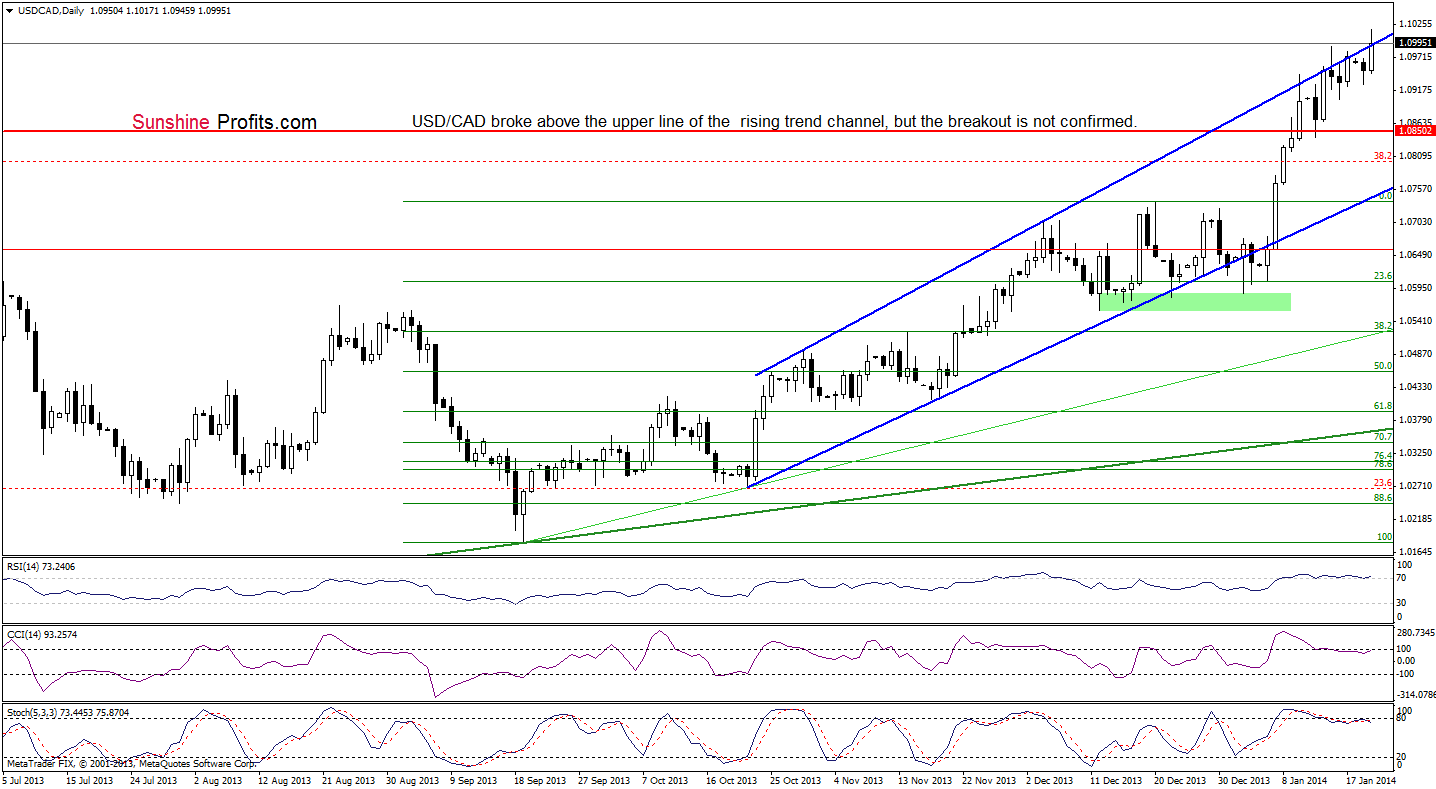
On the above chart, we see that USD/CAD moved higher and broke above the upper line of the rising trend channel once again. Although this is a positive signal, we saw similar moves in recent days. However, back then they all failed and it seems that we may see similar price action also today. This assumption is in tune with negative divergences between the indicators and the exchange rate. From this point of view, it seems that further deterioration is just around the corner. Please note that the RSI is still overbought and sell signals generated by the two other indicators remain in place supporting the bearish case.
Very short-term outlook: mixed with bearish bias Short-term outlook: bullish MT outlook: bullish LT outlook: bearish
Trading position (short-term): we do not suggest opening short positions yet because the pair hasn’t invalidated a small breakout above the long-term declining support/resistance line on the weekly chart and this line still serves as support. We will keep you informed should anything change, or should we see a confirmation/invalidation of the above.
USD/CHF
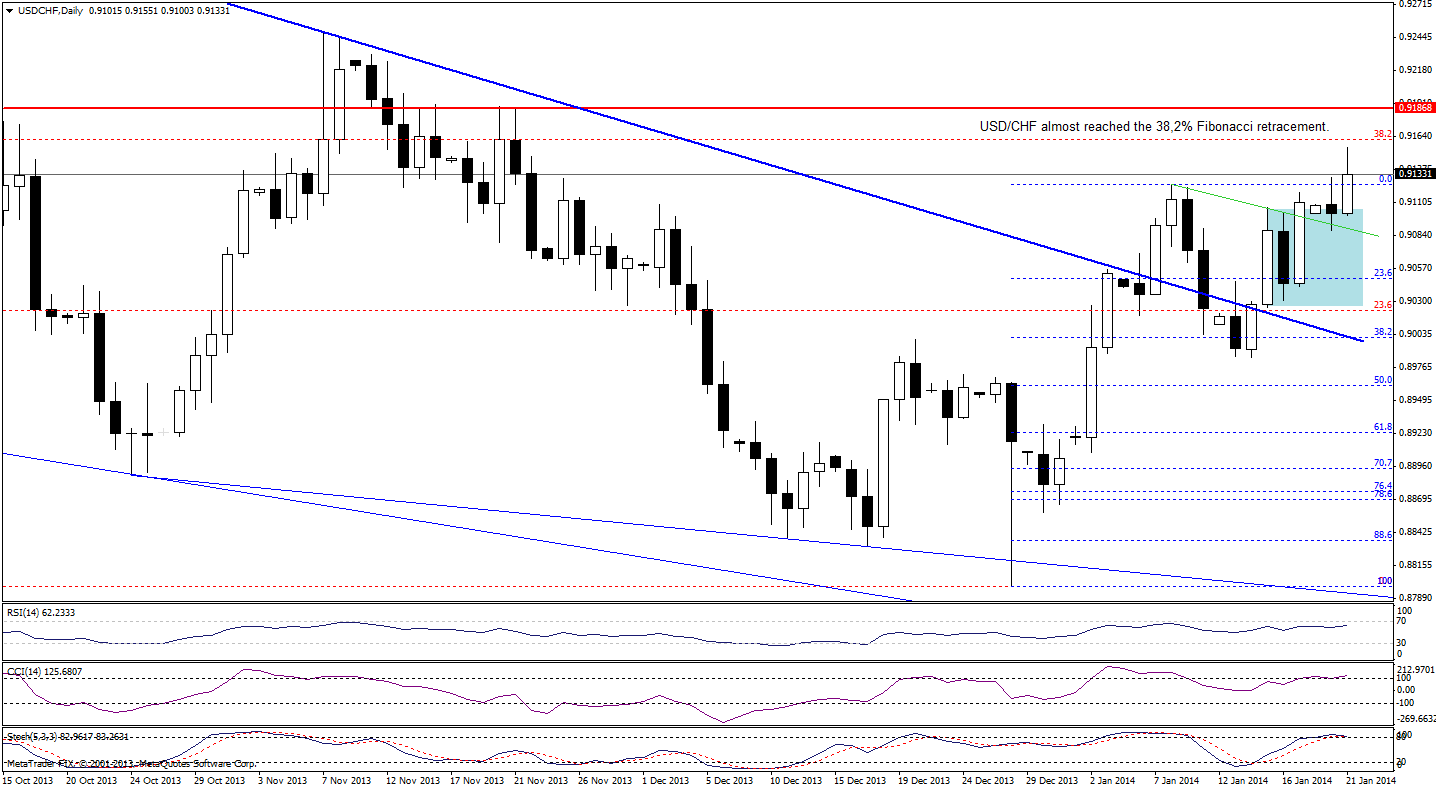
Looking at the above chart, we see that USD/CHF bounced off the very short-term support/resistance line (marked in green) and extended gains. With this upward move, the pair climbed above yesterday’s high and almost touched its first upside target – the 38.2% Fibonacci retracement level. As you see on the daily chart, USD/CHF still remains above the previous January high, which is a positive signal and another attempt to move higher should not surprise us.
Nevertheless, we should keep in mind that the CCI and Stochastic Oscillator are overbought, while the RSI remains slightly below the level of 70, which suggests that a pause or even a correction is just around the corner.
Very short-term outlook: mixed with bullish bias Short-term outlook: mixed MT outlook: bearish LT outlook: bearish
Trading position (short-term): long. The stop-loss level for this position is at 0.8985. The upside price target is around 0.9160. This position is already quite profitable. We will keep you informed should anything change, or should we see a confirmation/invalidation of the above.
AUD/USD
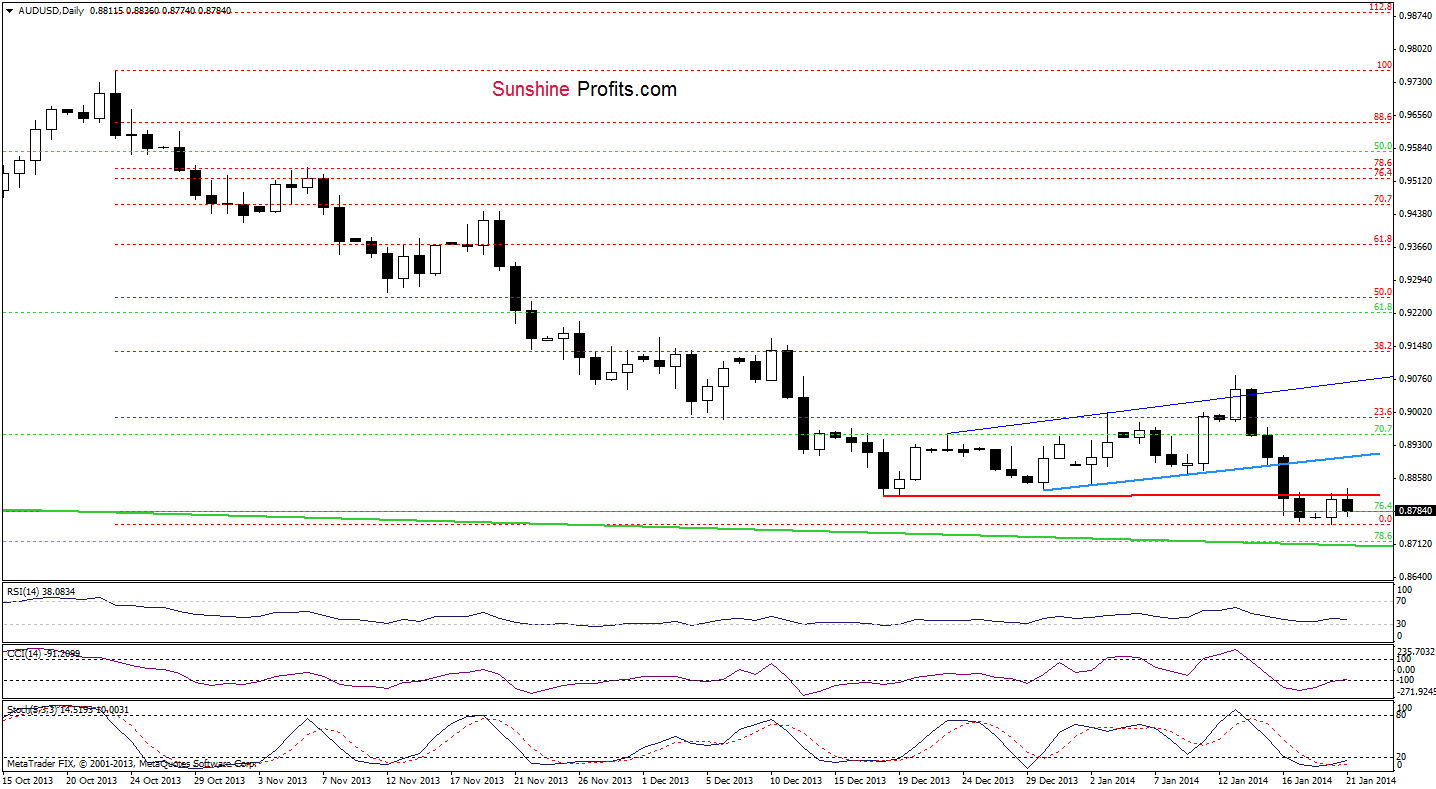
On the above chart, we see that the situation hasn‘t changed much and what we wrote in our previous Forex Trading Alert remains up-to-date.
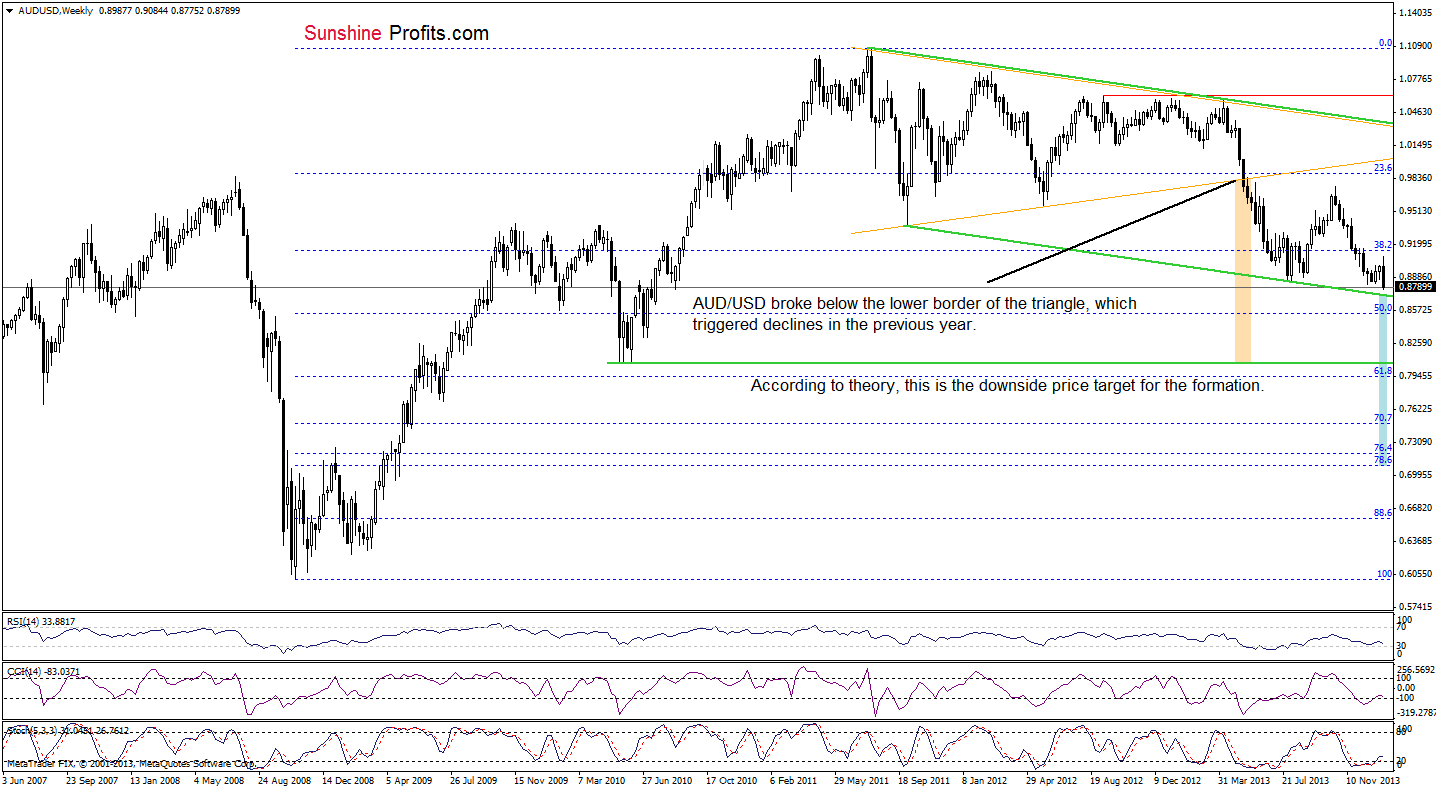
(...) despite a small increase, the pair still remains not only below the previously-broken very short-term support line, but also the December low. From this perspective, it seems that this increase may be nothing more than the verification of the breakdown (below the previous low). If this the case, another downswing should not surprise us and the next price target will be the 78.6% Fibonacci retracement, which intersects with the lower border of the declining trend channel (seen on the weekly chart below). However, when we take a closer look at the position of the indicators, we see that the CCI and Stochastic Oscillator are overbought and the RSI remains slightly above the level of 30, which suggests that a pause or an upswing is just around the corner.
From this perspective, it seems that the space for further declines is limited because a strong support zone (slightly below the current level) may pause or even stop further deterioration. This assumption is reinforced by buy signals generated by the CCI and Stochastic Oscillator.
Very short-term outlook: bearish Short-term outlook: bearish MT outlook: bearish LT outlook: bearish
Trading position (short-term): we do not suggest opening short positions at the moment as it seems that the space for further declines is limited by the strong support zone created by the 78.6% Fibonacci retracement and the lower border of the declining trend channel. We will keep you informed should anything change, or should we see a confirmation/invalidation of the above.
Thank you.
Nadia Simmons
Forex & Oil Trading Strategist
Forex Trading Alerts
Oil Investment Updates
Oil Trading Alerts
