
Since my previous essay the short-term situation in light crude has improved once again. Yesterday U.S. crude oil prices were boosted by Federal Reserve Chairman Ben Bernanke's testimony before Congress in which he reiterated that the Fed would only start phasing out its stimulus once it is sure the economy is strong enough to stand on its own.
Yesterday we also found out that the new claims for jobless benefits fell in the world's biggest economy. The day before, a weekly report from the Department of Energy showed once again that the crude oil stocks are rapidly declining. The actual decline was more than 6.9 million barrels. Over the last three weeks, crude oil inventories have declined by 27.1 million barrels, which is the largest three week decline in at least 30 years.
The combination of Ben Bernanke's comments, strong data and a further decline in crude oil inventories pushed U.S. crude oil to over $108 per barrel which is its 16-month high.
Having discussed this interesting piece of data, let's take a closer look at the light crude's charts and find out where the nearest support zones and resistance levels are. What's the current outlook for U.S. crude oil?
As I wrote in my essay on crude oil on July 16, 2013:
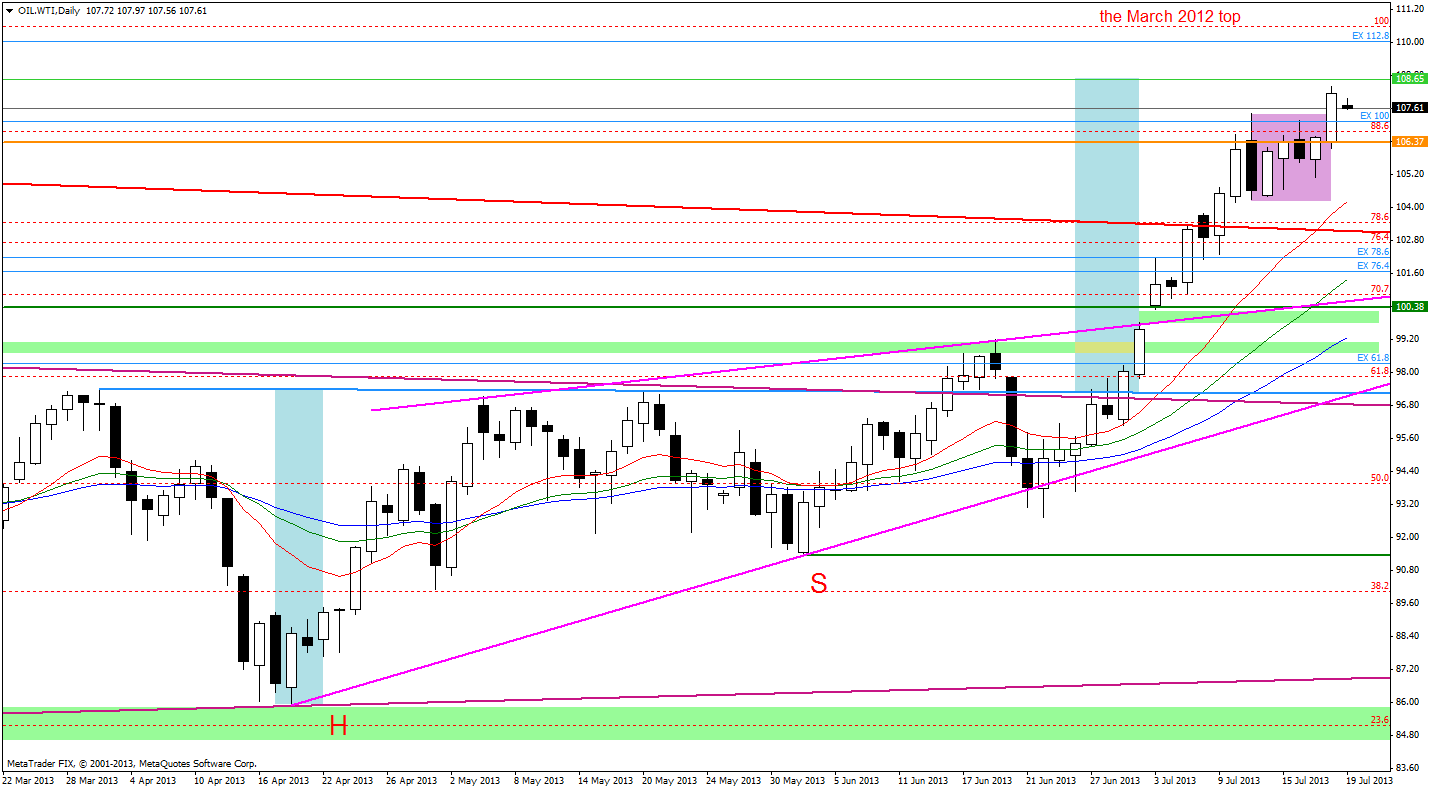
The recent days have formed a consolidation on the chart. If the oil bulls manage to break above the Thursday's top, the price might increase to at least $108.65 where the price target for the inverse head and shoulders pattern is.
On the above chart we see that the yesterday's increase has led light crude's price to over $108 per barrel and the price target for the inverse head and shoulders pattern was almost reached.
On the one hand, taking this into account, we may see a bearish scenario: closeness to this target level may encourage investors to take profits after four weeks of growth. In this case the first support level is around the Monday low. The next one is the bottom of the last corrective move (the July 11 low).
On the other hand, the oil bulls might want to achieve their own pro-growth scenario. Do you still remember the inside bar candlestick pattern (a purple rectangle on the daily chart)? As I wrote in my previous essay, if the buyers manage to break above the resistance level (the July 11 top) the price target for the pattern will be around the March 2012 top. Yesterday we saw a breakout, so the way to higher levels is still open.
Once we know the current situation from the daily chart, let's zoom in on our picture of the oil market and see the 4-hour chart.
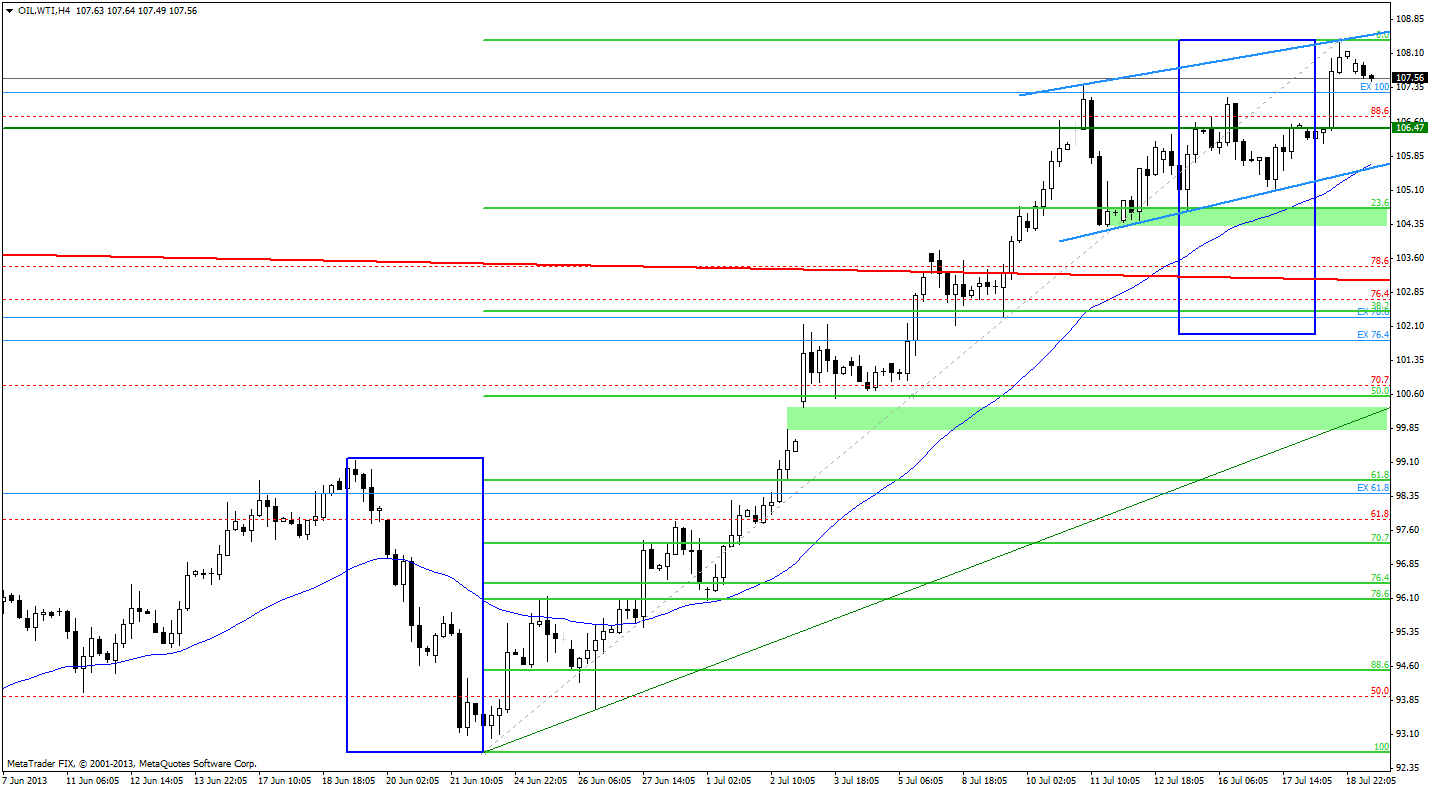
In my last essay I wrote that the recent decline was quite small and the correction didn't even reach the 23.6% Fibonacci retracement level. These circumstances encouraged oil bulls to fuel the rally which resulted in a new 16-month high.
As I previously mentioned, in this way the price target for the inverse head and shoulders pattern was almost reached. Today we see a small corrective move, but it didn't take oil below the July 11 top so far.
On the above chart we see a blue rising channel. The upper line is based on the July 11 top and yesterday high. The bottom line is based on the July 11 and Wednesday's lows. It seems that light crude's moves will unfold in this price channel in the near future. From this perspective, the first target for the oil bears is the May 2012 top. If it is broken, the next target for the sellers is the bottom line of the above-mentioned rising channel. This area is also supported by the 45-day moving average, which was broken on June 27 and serves as support.
When we factor in the Fibonacci price retracements, we clearly see that there is still much room for further declines because the 23.6% retracement level is much lower than where the price is today. Please note that this retracement level is slightly above the July 11 bottom and forms with it a strong support zone.
Summing up, the price of light crude has moved higher once again and climbed up to a 16-month high. In this way, the price target for the inverse head and shoulders pattern was almost reached which may encourage investors to take profits after four weeks of growth. In this case we should consider a bearish scenario - a decline to, at least, the May 2012 top. If it is broken, the next target for the sellers is the bottom line of the blue rising channel (drawn on the 4-hour chart). It is possible that this line will stop the decline, but if it is broken, the price may drop to the support zone based on the 23.6% Fibonacci retracement level and the June 11 low. However, the short-term technical situation remains bullish and from my point of view, the uptrend is not threatened yet.
Thank you.
Nadia Simmons
