
This essay is based on the Premium Update posted on October 29th, 2010. Visit our archives for more gold & silver articles.
Robert Parker is a well known investment expert, Senior Advisor at Credit Suisse and a frequent television commentator. So when we had a chance to hear him give a presentation to an exclusive group of the bank's heavy weight clients in an invitation-only event, we were interested to hear what he had to say. Or more to the point, we wanted to know what the bank's wealthiest clients are hearing.
Parker brought up gold towards the end of his presentation, but since that topic interests us the most, we'll bring it up first.
The official Credit Suisse policy is that investors should have 10% of their portfolio in gold. Parker doesn't like gold at its current prices and prefers investing in South African gold mines or better yet, Russian mines, which he says are very cheap. Although he doesn't see much upside to commodities, neither does he see much downside risk. Assuming further downward pressure on the US dollar, the gold price could test $1,400/ounce by the first quarter of next year, though speculative long positions are now becoming extended, he said.
Nobody has a crystal ball to predict what gold will do, but we don't agree with Parker's analysis. We believe that the bull market still has a long way to run (the high for gold in the '70 - '80 bull market in "real" inflation-adjusted terms is over $6,000). Think about it - even if gold bears see higher prices ahead then we are definitely in the correct market. Generally, we agree with the Credit Suisse policy of at least 10% of the portfolio in gold. (In the Key Principles section of our website we explain how to structure your gold portfolio.) According to a Bloomberg report ,just this week a Chinese newspaper affiliated with the Ministry of Commerce said China should buy more gold to diversify its foreign exchange reserves. China should increase its gold holdings if the country aspires to "internationalize" its currency, the paper said on its website. This is just one reason why we believe gold has a long way to go before it reaches bubble territory.
Parker showed an interesting graph of long-term risk appetite (fear and greed) going back to 1981.
We are moving back to panic territory, he said. Investors are cautious and there is a lot of cash sitting on the sidelines. Let me remind you that you earn close to zero on cash and that cash will have to move somewhere.
At Sunshine Profits we believe a good portion of the cash sitting on the sidelines looking for a safe haven will be channeled into gold, but not necessarily right away. One of the reasons for the latter is visible on the following chart (charts courtesy of http://stockcharts.com).
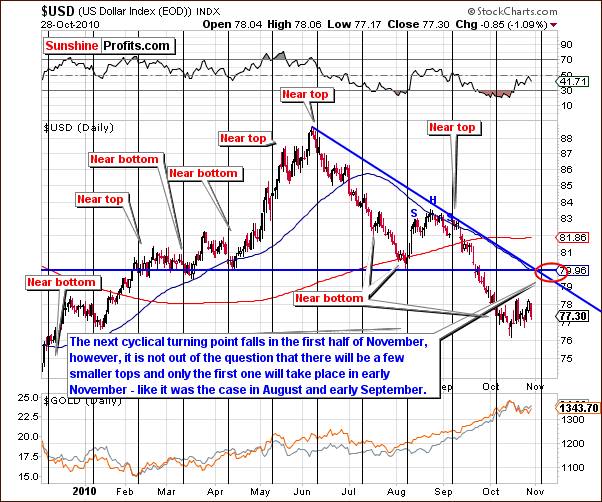
Namely, because it appears that USD Index levels are likely to rise in the short-term. Since it used to move in the opposite way to gold, silver, and mining stocks, a quick rally here would most likely cause a decline in the metals' prices.
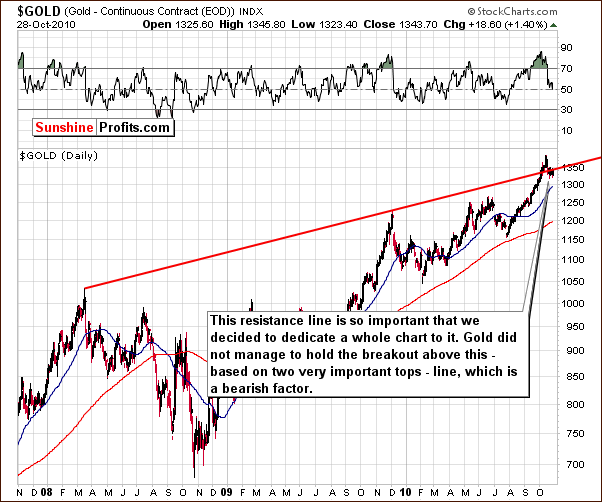
In the long-term chart for gold this week, we see an important development with respect to the upper border of the trading channel. As you might have noticed we are not using the GLD ETF but gold itself. This is because sometimes the very long-term trend lines could be disordered when analyzing ETF's.
The key point is that since this is clearly seen on a long-term chart, it is of greater significance than observations made and inferences gathered from a week or two of price action such as is seen in typical short-term charts. This trend line has held despite gold's attempt to move above it, and since gold consolidates below the line, it has strong bearish implications for the short-term. Gold has moved above this line on Friday, but this rally was not confirmed by huge volume.
The GLD ETF short-term chart with detailed price targets is included in the full version of this report available to our Subscribers.
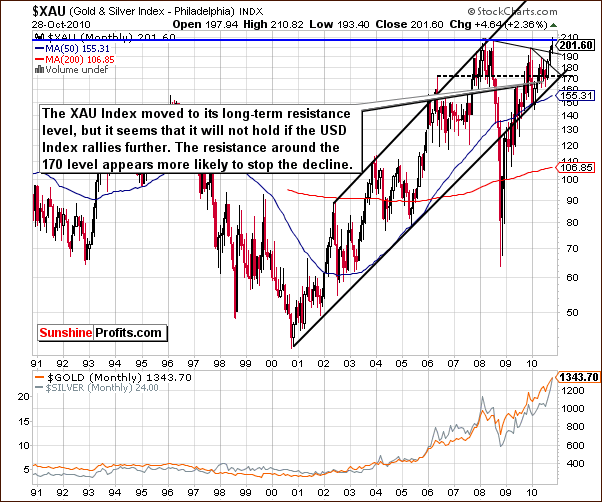
The XAU Index, which is a proxy for gold and silver stocks, bounced off an important 2008 high as visible on this very long-term chart. Since that time it has been consolidating and initial declines were followed by slight increases. Recent support levels have not been as strong in nature as the all-time high, which created the decline initially.
Consequently, it's quite likely that we could see this period of decline for some time before an eventual bottom is reached. Volume levels have been quite small when compared to what we have seen during the decline.
Summing up, although much appears to have happened, very little has changed in the past week. Consolidation has been seen in the USD Index and volume levels seen in the UUP Index suggest higher values will be seen soon for the USD. The general stock market has consolidated slightly and we have seen small price increases on some days. Resistance levels have now been reached and indications are that we will see lower values very soon. Daily volume levels support this bearish sentiment.
With positive correlation with stocks and negative correlation with the USD Index, gold, silver and mining stocks should continue to correct in the coming days and weeks. No big rally is expected until perhaps late November.
To make sure that you are notified once the new features are implemented, and get immediate access to my free thoughts on the market, including information not available publicly, I urge you to sign up for my free e-mail list Sign up today and you'll also get free, 7-day access to the Premium Sections on my website, including valuable tools and charts dedicated to serious PM Investors and Speculators. It's free and you may unsubscribe at any time.
Thank you for reading. Have a great weekend and profitable week!
P. Radomski
--
This week we eavesdrop on what a senior advisor at Credit Suisse is telling the banks wealthiest clients in an exclusive, invitation-only event. We get access to the banks vast resources and top notch research department. We disagree on his take on gold, but like what he had to say about the chances for a double dip recession, about inflation versus deflation and his approach to equities.
We have incorporated 16 charts this week to provide visual depth to our discussions about recent market activity and to further clarify what can be expected in the days and weeks ahead. Our 4 gold charts and 3 each for silver and mining stocks are accompanied this week by additional charts related to the USD Index (3 charts) and stocks (2 charts) as well as our weekly correlation matrix.
An in-depth discussion about the relationships between these markets as well as cause-and-effect theories based on historical trends is the heart and soul of our weekly publication. Once again we will explain our specific expectations and support these with facts and related technical tools as we strive to assist our Subscribers in what to watch for and what to expect as these turbulent time continue. We encourage you to Subscribe to the Premium Service today and read the full version of this week's analysis right away.
