
In this commentary we are going to briefly go through the recent developments in the precious metals equities and it’s relative performance to the U. S. Dollar Index. In one of our previous essays we have analyzed Dollar chart patterns and have found striking similarities between the recent price action and the situation on the market two years prior to that moment. It seems that this analogy can still be applied today.
This tells us something about the future movement in the price of the U.S. Dollar, however this time we would like to focus on the implications regarding the precious metals stocks. We have analyzed the price patterns and time frames and we think that the situation in the gold stock sector is also analogical to the one that took place more than 2 years ago. Before we proceed with presenting the chart with the HUI Index, we would like to point your attention to the U.S. Dollar chart (courtesy of www.stockcharts.com).
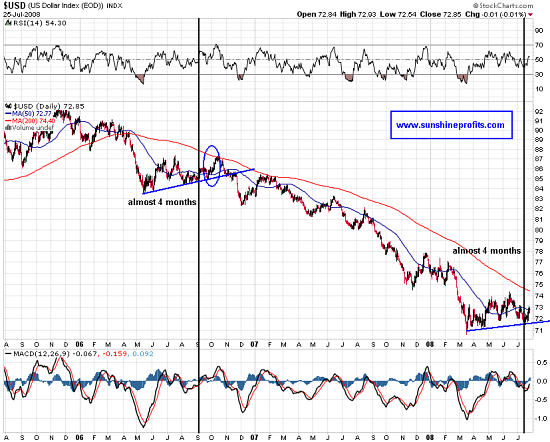
The black, vertical lines represent time, when the USD bounced first time after the consolidation following the fall and a rebound. Prior to both lines we can see very similar price patterns. A huge slide, double-bottom, correction ending with a double-top and then a consolidation near the previous lows. During this consolidation we see occasional, short-lived rallies. Finally, at some point one of the upswings corresponds to a sell-off in the PM stocks.
That was the case more than 2 years ago and it was the case quite recently. What is even more interesting is that it took a very similar amount of time from one sell-off to another – almost 4 months. After that, the U.S. Dollar rallied a bit more, only to plunge several weeks later. This does not necessarily mean that the same will happen right now, but it surely is probable. We have just had a sharp sell-off in the PM stocks and the question, which troubles almost every gold and/or silver investor is whether that was it or not. Below you can find a long term chart of the HUI Index, which we will use as a proxy for gold stocks.
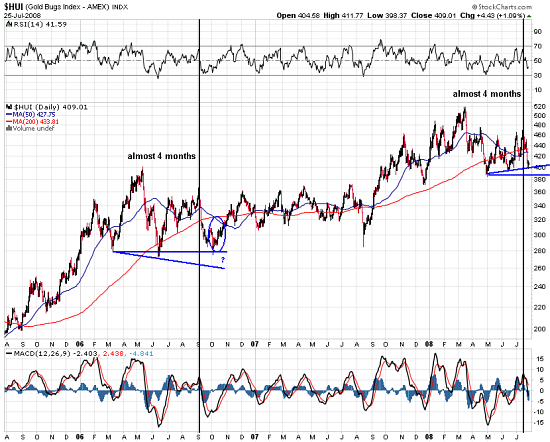
Gold stocks have recently experienced a sharp decline, 4 months after the previous top. Two years ago, such a phenomenon spelled a very good buying opportunity that was not matched until almost a year later, in August. This time such a chance may not repeat, so it makes sense to take advantage of it, if you are not fully invested by now.
The more specific one wants to be in the technical analysis, the more difficult it gets. We think that we are at or near the bottom, but most of our Readers probably want to know exactly what to look for, when determining the bottom. One of the ways of doing that is checking what has stopped the decline before, and another way is to see when PM stocks refuse to fall, as USD strengthens.
As far as the support level is concerned, it is impossible to tell whether two years ago the HUI Index was going down to the levels achieved at the previous lows or did it just fall to the first serious support. Right now the first support is the trend line, which implies that we have just bottomed at around the 400 level on the HUI. However, if gold stocks are to fall to their previous lows then we might witness a little more temporary pain in the sector, probably taking the HUI down to the 385 - 390 level.
One of the most important confirmations of the bottom is to see gold stocks not declining, when you would expect them to. If the USD is concerned, we expect to see the HUI Index holding at current levels, should the dollar continue to rise for several days/weeks. This would indicate that this market is running out of people willing to sell right now. Consequently, some of the sellers (mostly momentum traders and/or people, who do not believe in the fundamentals of this sector) will turn into buyers as USD stops to rise. This is what took place in the past. We have marked this situation with the blue ellipse on both the USD and the HUI charts. If this is to be repeated, we might see the dollar’s rise along with A very slow decline in the PM stocks, probably to the 385-390 level.
Summing up, we view the current situation as a good moment to be adding to your long term positions, if you are not yet fully invested with that type of capital.
Of course the market might prove us wrong, as nobody can be right 100% of the time. Should our view on the market situation change substantially, we will send an update to our registered Users along with suggestions on how to take advantage of it. Register today to make sure you won’t miss this free, but valuable information. You’ll also gain access to our Tools section. Registration is free and you may unregister anytime.
P. Radomski
