
Based on the November 2nd, 2012 Premium Update. Visit our archives for more gold & silver articles.
We summarized our previous essay (Oct 31, 2012) by stating that the correction in metals may not be over yet. It looked like it’s over in case of the mining stocks, at least in terms of price.
This has been quite a week. Not only has the hurricane Sandy showed us how vulnerable we are to the large and indifferent forces of nature, but we also saw how markets can plunge even though the fundamental situation did not deteriorate. In the short run markets don’t act on fundamentals – they move based on investors’ emotions and short-term price swings will always be present. Just as we can’t eliminate weather’s unpredictability, we can’t control what will happen on the market in the short run, even though we are convinced about the existence of the gold bull market. There are some things that we can do about it though – in both cases we can prepare to some extent. In case of the stock market and the precious metals market we can use charts and technical analysis to estimate what may be waiting just around the corner. In the following part of the essay we will do just that and we will focus on stocks, crude oil and gold markets.
Let’s start with the S&P 500 Index (charts courtesy by http://stockcharts.com.)
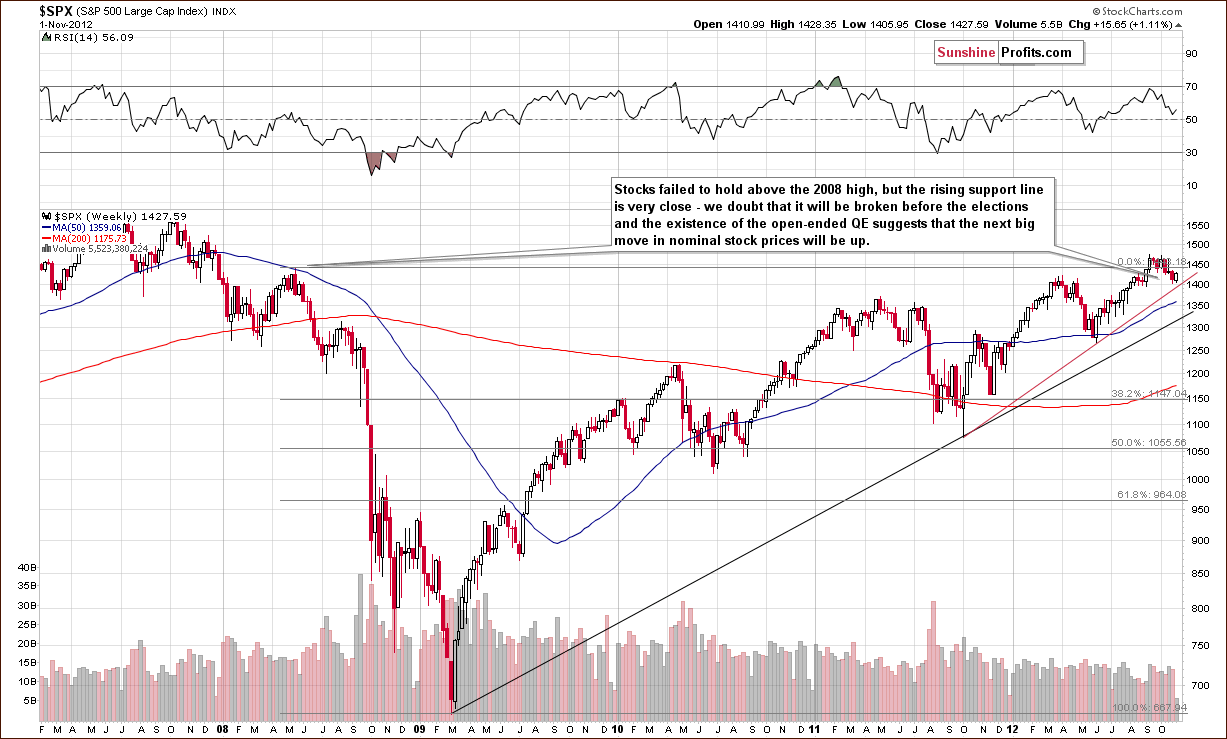
We did see a pullback in stock prices (SPX) this week, but the rising red support line has not yet been reached. It seems therefore that further weakness could be seen before stocks form their bottom. A day or a few of them of declines followed by a strong rally just before the Election Day seems to be a likely scenario. There’s also a possibility of a rally without an additional move lower.
Let us now move on to the Crude Oil, as this commodity is quite useful in analyzing the precious metals market and also seems susceptible to the influence of the Elections.
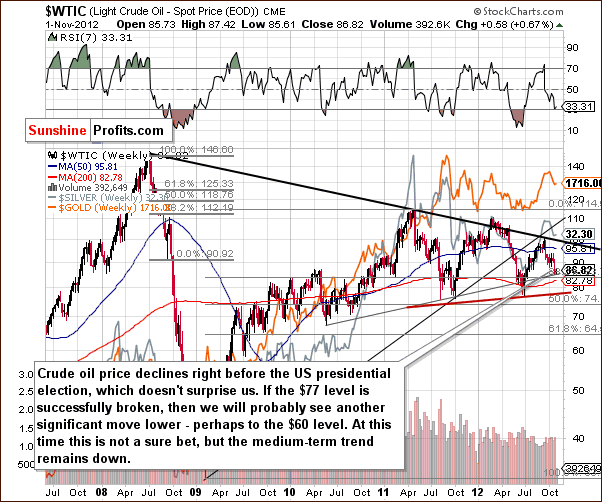
This week, we have seen a further deterioration in prices (WTIC). At this time it seems that the medium-term trend for crude oil prices is down, and if the neck level in the head-and-shoulders pattern is broken, then the downside target level would be close to $60. This is considerably lower (about 30%) than today’s crude oil price and would not necessary bring gold and silver down as significantly. Such a case was seen in mid-2011. All-in-all, however, the short-term implications here are bearish for the precious metals.
Let us have a look at the intermarket correlations to see what the above developments could mean for precious metals.
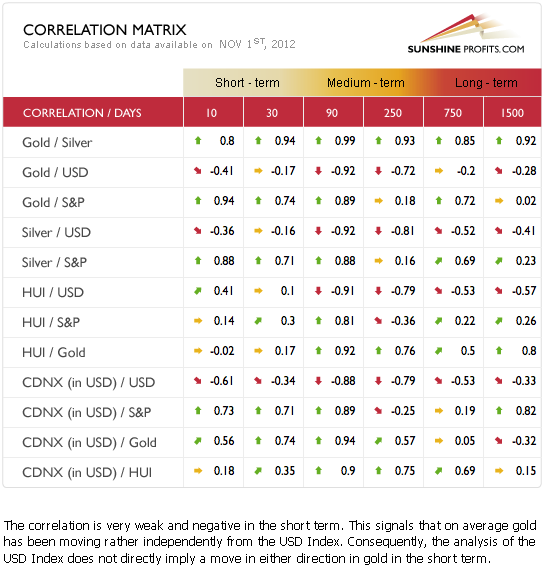
The Correlation Matrix is a tool which we have developed to analyze the impact of the currency markets and the general stock market upon the precious metals sector. We continue to see little correlation between the USD Index and gold and the rest of the precious metals. This can be attributed to what has happened within the past month where metal prices declined despite the lack of a rally in the USD Index. This is a bearish factor for gold, silver and the mining stocks.
The general stock market is positively correlated with the precious metals. This has bullish implications in these days just before the US elections. However, since gold price increases are not really what the Powers That Be prefer to see right now (implications of inflation), we could see some deviation from the normal correlations. The point is that significant coefficients should not be considered as useful as they normally are. In short, the overall implications of this table are bearish to neutral for the precious metals sector.
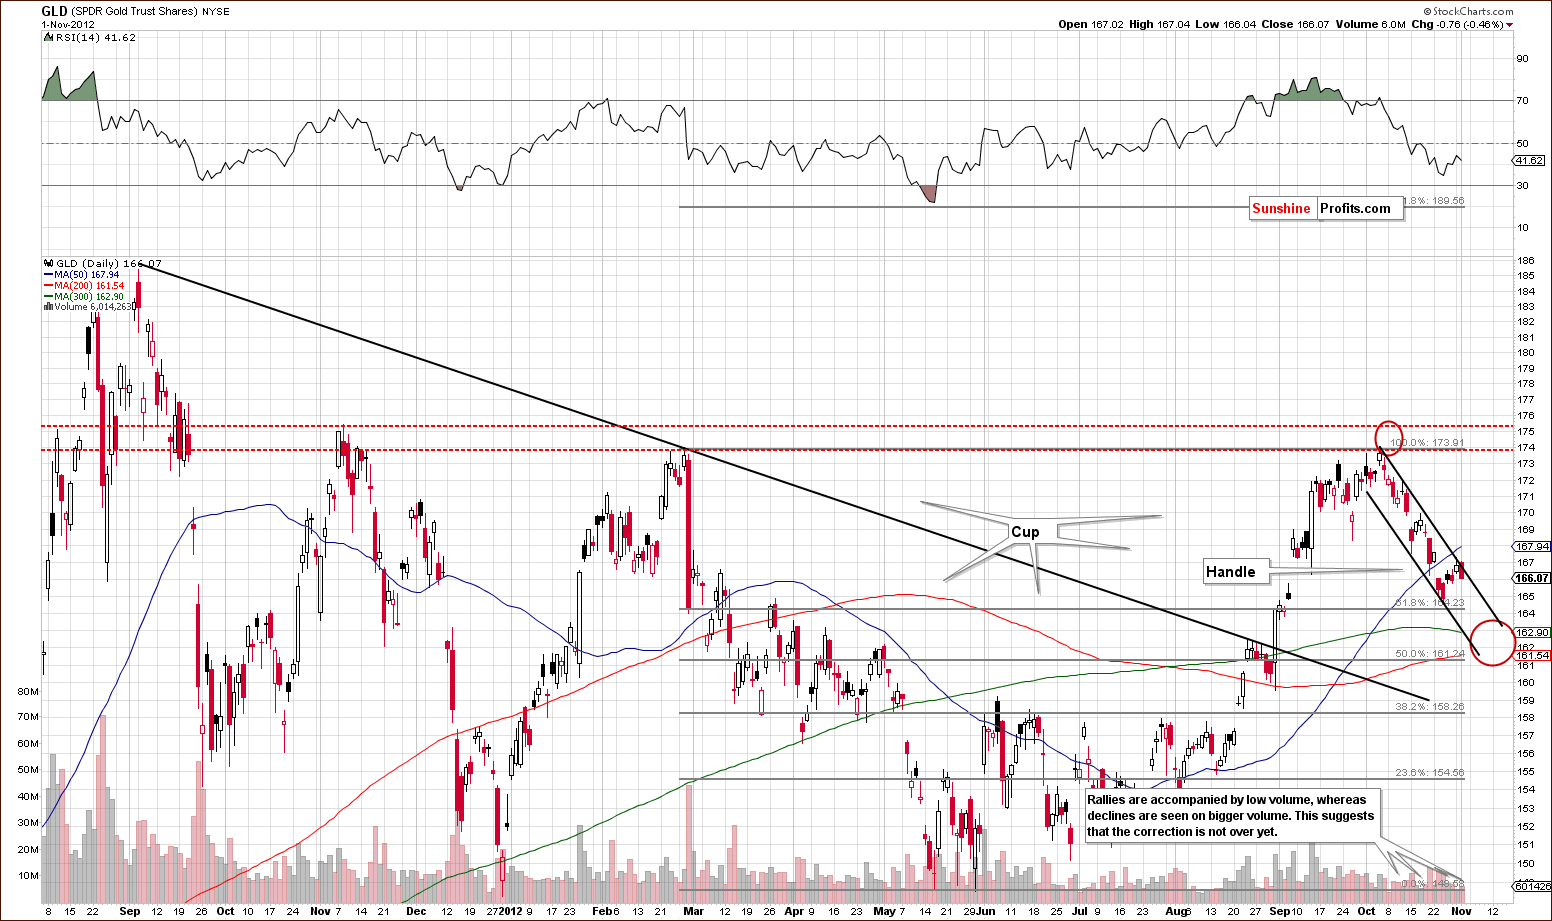
Analysis of the short-term GLD ETF chart once again gives us bearish implications based on price trends and price/volume action. Declines have been accompanied by relatively high volume and no breakout has been seen. In Wednesday’s Market Alert, we commented on the resistance lines of gold and silver in the following way (the above chart provides illustration):
Gold and silver moved higher, but they didn't move above their short-term declining resistance lines. In case of the GLD ETF and SLV ETF such lines are created based on intra-day highs of Oct 4 and Oct 11.
For the yellow metal, the line was touched but not broken and gold prices declined on Thursday. The question is “when will the downside target levels be reached”? Based on the above chart it seemed that the bottom was likely about a week or so away, however, based on today’s price decline it seems that the decline may be already over today.
Summing up, the short and medium term picture for Crude Oil is bearish which may translate into lower precious metals prices in the near future. The general stock market is mixed for the short term and the final support line for stocks has not yet been reached. With Election Day looming, however, some strength is possible for stocks in the coming days. This will probably have a positive impact on the precious metals. Based on Friday’s decline, it seems that the bottom in the precious metals sector might have just been reached.
Please keep in mind that if you are interested in short-term signals for gold, silver and mining stocks, then you can monitor our in-house developed indicators free of charge - there's a 5-trading-day delay, but even this version should be profitable for you. Actually, some indicators are followed by rallies that really pick up after a few days after a signal is seen and then continue for a few more weeks - so there's still time to take advantage of the signal and make some quick profits. Please feel free to examine the expected performance of gold, silver and mining stocks after each of the signals is seen in the details & performance section. This week, we posted (available for everyone) details regarding stop-loss orders for our indicators - we suggest examining them, as this is something that should make you more convinced that the levels (and numbers presented in the details & performance section) are no coincidence.
In other news, right after we posted today's Premium Update we sent out a notification that we just started preparing a Market Alert, and within 30 minutes after that we posted / sent out the Alert with details (targets, stop-loss levels) regarding speculative short and long positions. If you'd like to read them (and gain access to our indicators and tools), you can do it here.
Thank you for reading. Have a great weekend and profitable week!
Przemyslaw Radomski, CFA
Back